Z-score standardization in statistics.
Unlock the power of data normalization with our comprehensive guide on Z-score standardization using Python! Dive into the world of statistical analysis and transform your data into meaningful insights by mastering the art of Z-score calculations. With our step-by-step tutorial, you'll not only learn the fundamentals of Z-score standardization but also discover how to implement it seamlessly in Python, elevating your data analysis skills to new heights. Get ready to embark on a thrilling journey that will reshape your understanding of data and its potential.

Python Knowledge Base: Make coding great again.
- Updated:
2026-07-21 by Andrey BRATUS, Senior Data Analyst.
Quick dive:
Z-Score Standardization in Research:
Creating data with Python:
Z-scoring and visualisation with Python:
Z-Score Standardization Vs Min-Max Scaling:
Common Pitfalls:
Conclusion:
A standard score or a z-score is used for standardizing scores on the same scale by dividing a score's deviation by the standard deviation std in a dataset. The result is a standard score thet measures the number of standard deviations that a given data point is from the data center - the mean.
Standardized data set has mean 0 and standard deviation 1, and retains the shape properties of the original data set (same skewness and kurtosis).
Hey there! Are you tired of trying to make sense of the data you've collected for your research, business or sports statistics? Fret not, because Z-score standardization is here to save the day! This statistical method takes into account the variation in your data, giving you an accurate representation of how your scores compare to the mean.
Z-Scores are essential in data analysis; it assists in determining the outliers in your dataset and provides a standardized way of comparing results across variables. For instance, let's say you have two data sets: the first set has a mean of 50 and a standard deviation of 5, while the second set has a mean of 100 and a standard deviation of 15. If you want to know who performed better between two individuals from these datasets, you can calculate their respective Z-scores and compare them on a common scale.
Z-score Standardization is an essential tool for statisticians, business analysts, and sport scientists alike. It helps in making informed decisions based on accurate statistical variables that assist in identifying areas that require improvements. Do you think Z score standardization could help in your business strategy? Stay tuned; we've got some interesting insights in store for you!
Ah, research - the lifeblood of academia. Without it, where would we be? Floating in a sea of speculation and conjecture, that's where! Enter z-score standardization. Why is it important? Where does it fit in the grand scheme of things? Let me tell you, friend.
First off, z-score standardization is a way to normalize scores so they can be compared across different variables. You wouldn't compare an apple to an orange, would you? Of course not! That's why we need standardization. It's like comparing apples to apples, or oranges to oranges. Simple, right?
But where does it apply? Well, it's used in all sorts of fields - from medicine to psychology, sociology to finance. Whenever there's a need for comparison - that's where it comes in. It's a handy tool to have in the old research tool belt.
But why stop there? Let's talk about why it's so important. For starters, it allows researchers to compare scores across different variables. Without it, we'd be lost in a sea of incomparable data. It's like having a universal translator for statistics.
And let's not forget about the applications. Not only does it help researchers compare data, but it also provides a way to examine the distribution of scores within a group. This can lead to important insights and discoveries. Plus, it can be used to identify outliers - those pesky data points that don't seem to fit in anywhere.
So there you have it, folks. A brief rundown on z-score standardization in research. Who knew statistics could be so exciting?
import matplotlib.pyplot as plt
import numpy as np
from scipy import stats
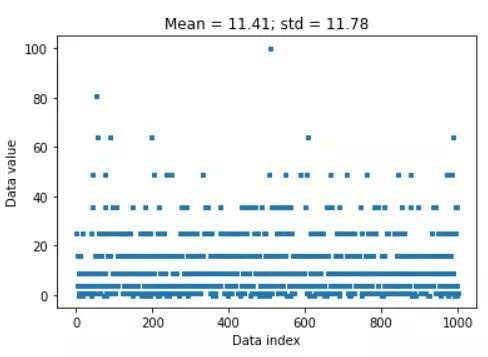
data = np.random.poisson(3,1000)**2
## compute the mean and std
datamean = np.mean(data)
datastd = np.std(data,ddof=1)
# the previous two lines are equivalent to the following two lines
#datamean = data.mean()
#datastd = data.std(ddof=1)
plt.plot(data,'s',markersize=3)
plt.xlabel('Data index')
plt.ylabel('Data value')
plt.title(f'Mean = {np.round(datamean,2)}; std = {np.round(datastd,2)}')
plt.show()
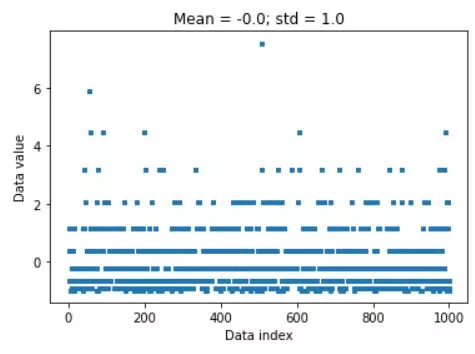
# z-score is data minus mean divided by stdev
dataz = (data-datamean) / datastd

# can also use Python function
dataz = stats.zscore(data)

# compute the mean and std
dataZmean = np.mean(dataz)
dataZstd  = np.std(dataz,ddof=1)

plt.plot(dataz,'s',markersize=3)
plt.xlabel('Data index')
plt.ylabel('Data value')
plt.title(f'Mean = {np.round(dataZmean,2)}; std = {np.round(dataZstd,2)}')

plt.show()
So, you've heard of Z-Score standardization and Min-Max Scaling. But, which one should you use? Let's dive into it.
Z-Score Standardization is the process of scaling data based on its mean and standard deviation. It is a more robust method for dealing with outliers because it is not affected by extreme values. On the other hand, Min-Max Scaling is a simple process that scales data between 0 and 1 based on the minimum and maximum values. It is a preferred method when you want to maintain the underlying distribution of your data.
The advantage of Z-Score Standardization is that it is less susceptible to errors due to extreme values in the data, but it can be difficult to interpret. Conversely, Min-Max Scaling is more intuitive and easy to understand but is more susceptible to outliers.
Ultimately, the choice of method depends on the nature of your data and the goals of your analysis. But there's no need to stress about it. Just take a deep breath and choose the method that suits your needs best.
So, you have learned the importance of Z-Score standardization in data analysis, but beware! There are some common pitfalls in using Z-Scores that can lead to incorrect usage and misinterpretation of results. One such pitfall is incorrect application of Z-score to non-normal data sets. Remember, Z-score assumes normal distribution, and if your data set is not normally distributed, then don't use Z-score blindly. Also, a common misinterpretation of Z-score results is confusing positive and negative Z-values. Positive Z-value indicates a value above the mean, whereas a negative Z-value indicates a value below the mean. So don't jump to conclusions without understanding the results. In short, be cautious and apply Z-score standardization appropriately, or you might end up with erroneous results.
Now that you have a comprehensive understanding of Z-Score Standardization, you can see how important and versatile it can be. From comparing scores across different variables to ranking percentiles, Z-score has many applications in research, business, and sports. Its significance lies in its ability to provide us with a universal metric for comparison. But beware of common pitfalls like misinterpreting the results and incorrect usage. Use it wisely, and you'll have a powerful tool at your disposal.