Let's dive in relation metrics.
Let's take you on a journey into the fascinating world of statistical analysis, where we explore the relationships and patterns between variables. Whether you're a data scientist, analyst, or simply curious about uncovering insights from your data, this guide will equip you with the knowledge and practical skills to calculate and interpret covariance and correlation using Python. Get ready to unravel the secrets hidden within your datasets and make data-driven decisions with confidence.
Let's dive in!

Python Knowledge Base: Make coding great again.
- Updated:
2026-07-19 by Andrey BRATUS, Senior Data Analyst.
Simulating correlated data:
3 ways to calculate covariance:
2 ways to calculate correlation:
Calculating correlation with statistical significance:
Conclusion.
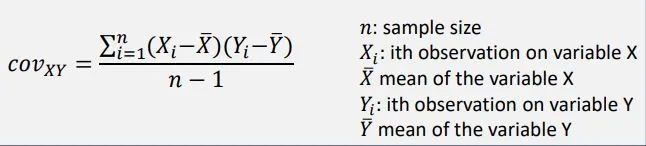
The covariance between two random variables measures the degree to which the two variables move together – it captures the linear relationship.
Interpreting covariance is simple: if the value is high, then the two variables are positively related, that is, if one variable increases, the other variable also increases. On the other hand, if the value is negative, then the two variables are inversely related, that is, if one variable increases, the other variable decreases.
Properties of covariance:
▪ positive covariance: variables move together
▪ negative covariance: variables move in opposite directions
▪ covariance of variable with itself == variance
Pitfalls of covariance:
▪ actual value of covariance not meaningful
▪ can range from minus to plus infinity
▪ squared units
The correlation coefficient (r) measures the strength of the linear relationship (correlation) between two variables. It´s the standardized
covariance and is easier to interpret as values are between -1 and +1.
There are two types of correlation: positive and negative. Positive correlation means that as one variable increases, so does the other. For example, the more you study, the higher your grades will be. Negative correlation means that as one variable increases, the other decreases. For instance, the more junk food you eat, the worse your health will be.
Correlation Coefficient (r) Interpretation:
r = 1 - perfect positive correlation
0 < r < 1 - Positive linear relationship
r = 0 - no linear relationship
-1 < r < 0 - negative linear relationship
r = -1 - perfect negative correlation
import matplotlib.pyplot as plt
import numpy as np
import scipy.stats as stats
N = 66
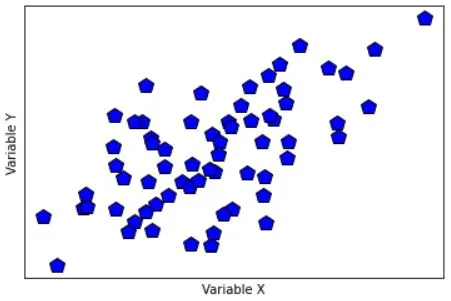
# generate correlated data
x = np.random.randn(N)
y = x + np.random.randn(N)
# plot the data
plt.plot(x,y,'kp',markerfacecolor='b',markersize=12)
plt.xlabel('Variable X')
plt.ylabel('Variable Y')
plt.xticks([])
plt.yticks([])
plt.show()
## compute covariance

# precompute the means
meanX = np.mean(x)
meanY = np.mean(y)

### the loop method
covar1 = 0
for i in range(N):
    covar1 = covar1 + (x[i]-meanX)*(y[i]-meanY)


# and now for the normalization
covar1 = covar1/(N-1)

### the linear algebra method
xCent = x-meanX
yCent = y-meanY
covar2 = np.dot(xCent,yCent) / (N-1)

### the Python method
covar3 = np.cov(np.vstack((x,y)))

print(covar1,covar2,covar3)
OUT:
0.9609676940493194 0.9609676940493196 [[1.03431923 0.96096769]
[0.96096769 2.32630356]]
## now for correlation

### the long method
corr_num = sum( (x-meanX) * (y-meanY) )
corr_den = sum((x-meanX)**2) * sum((y-meanY)**2)
corr1 = corr_num/np.sqrt(corr_den)


### the Python method
corr2 = np.corrcoef(np.vstack((x,y)))

print(corr1,corr2)
OUT:
0.6195099623133035 [[1. 0.61950996]
[0.61950996 1. ]]
r,p = stats.pearsonr(x,y)
print(r,p)
OUT:
0.6195099623133037 2.926584255137327e-08
So there you have it – a comprehensive breakdown of covariance and correlation in statistics, explained in a way that's both easy-to-understand and entertaining to read. With Python and its data analysis libraries, we can easily implement these statistical concepts into our work and achieve more meaningful insights. So go ahead, try implementing these techniques in your own projects and see the results for yourself. Happy analyzing!