MIN-MAX scaling in statistics.
Unlock the power of Python MIN-MAX scaling and elevate your data preprocessing game! In this comprehensive guide, we'll dive into the world of data normalization, exploring the ins and outs of MIN-MAX scaling in Python. With practical examples and step-by-step instructions, you'll learn how to transform your raw data into a more digestible format, improving model performance and setting the stage for exceptional data analysis.
Get ready to master this essential technique and become a true data normalization pro!

Python Knowledge Base: Make coding great again.
- Updated:
2026-08-02 by Andrey BRATUS, Senior Data Analyst.
Understanding Min-Max Scaling.
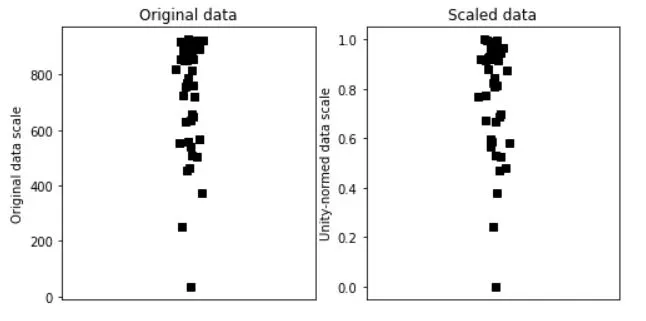
Creating data and MIN-MAX scaling:
Scaling to arbitrary data range:
Advantages and Disadvantages of Min-Max Scaling.
Different Approaches to Min-Max Scaling.
Conclusion:
In data processing scaling is a method used to normalize the range of independent variables or features of data, it is also known as data normalization and is generally performed during the data preprocessing step. MIN-MAX scaling or MIN-MAX normalization is the simplest method and consists in rescaling the range of features to scale the range in [0, 1] or sometimes [−1, 1] which is called unity-normed data scale. Selecting the target range depends on the nature of the data.
So you must have heard about min-max scaling, something that sounds like an aerobics warm-up exercise. But in reality, it's a fancy term for rescaling your data into a specific range. You might ask why on earth would you need to do this? Well, it's crucial for data analysis as it helps you compare and normalize data across different features. Min-max scaling is used in various fields such as finance, economics, and medicine. So whether you're trying to analyze the trends in the stock market or predict a patient's likelihood of developing a disease, min-max scaling is a tool you should have in your arsenal. Let's dig deeper and understand how it works.
Feature scaling is a data preprocessing step that ensures all features in a dataset have the same scale. Min-Max Scaling is a widely used feature scaling method that uses the minimum and maximum values of each feature to scale the data.
The method works by subtracting the minimum value of a feature from each value in that feature and then dividing the result by the range of the feature. This rescaling ensures that all features are on the same scale, between 0 and 1.
The formula for min-max scaling is straightforward, making it easy to implement. You can apply it to an entire dataset or individual columns. Not only is it easy to implement, but it is also fast, and it preserves the shape of the original distribution as long as there are no outliers.
import matplotlib.pyplot as plt
import numpy as np

N = 42
data = np.log(np.random.rand(N))*234 + 934

# get min and max
dataMin = min(data)
dataMax = max(data)

# now min-max scale
dataS = (data-dataMin) / (dataMax-dataMin)


# now plot
fig,ax = plt.subplots(1,2,figsize=(8,4))
ax[0].plot(1+np.random.randn(N)/20,data,'ks')
ax[0].set_xlim([0,2])
ax[0].set_xticks([])
ax[0].set_ylabel('Original data scale')
ax[0].set_title('Original data')

ax[1].plot(1+np.random.randn(N)/20,dataS,'ks')
ax[1].set_xlim([0,2])
ax[1].set_xticks([])
ax[1].set_ylabel('Unity-normed data scale')
ax[1].set_title('Scaled data')

plt.show()
## any arbitrary data range

# step 1 is to [0,1] normalize as above

# step 2:
newMin = 4
newMax = 8.7

dataSS = dataS*(newMax-newMin) + newMin

# test it!
print([min(dataSS), max(dataSS)])
Min-max scaling is a powerful feature scaling method that has many benefits in data analysis. However, it also has some disadvantages that must be taken into account. One of its primary disadvantages is that it limits the use of statistical analyses. This is because min-max scaling changes the distribution of the data, making it more difficult to apply traditional statistical tests.
Another disadvantage of min-max scaling is that it may enhance the impact of outliers. Outliers can have a significant effect on the min-max scaling process, pushing other values closer to 0 or 1. This can result in distortion of the data and potential inaccuracies in the analysis.
Finally, min-max scaling can reduce the range of data values, which can also impact the accuracy of the analysis. This is because the scaling process compresses the data into a narrower range, potentially losing important information and detail.
Despite these disadvantages, min-max scaling remains a popular and effective tool for data analysis. By understanding the limitations of this method, analysts and researchers can make informed decisions about how and when to use it.
Now that we understand the basics of min-max scaling let's discuss the different approaches available. Firstly, there is the standard min-max scaling approach that we've covered so far, where we subtract the minimum value from each value in the dataset and divide it by the range's maximum value. This technique works well for a dataset with few outliers.
The second method is reverse min-max scaling, which is popular in image processing. Instead of normalizing the data to a range of [0, 1], the data is reversed to a range of [1, 0]. This approach makes it easier to distinguish the image's darker and lighter parts.
Thirdly, there is min-max scaling with mean normalization. This technique involves normalizing each data point with respect to the mean of the entire dataset in addition to the minimum and maximum values. This approach helps in normalizing the data with a skewed distribution.
The fourth approach is normalization with decimal scaling. This approach multiplies each data point with an appropriate power of 10 to bring it to a desired range, making it more robust to outliers.
Finally, we can compare and contrast the different approaches to min-max scaling. Simple min-max scaling is the easiest to comprehend and implement, but it can lead to issues with outliers and data ranges. Reverse min-max scaling is ideal for image processing, while min-max scaling with mean normalization works well for skewed distributions. Normalization with decimal scaling is robust to outliers but may lead to loss of information.
Overall, the choice of method for min-max scaling boils down to the characteristics of the data at hand. Experimentation and exploration can help determine the best approach that yields the most accurate results.
To sum up, min-max scaling is a powerful technique for data analysis that offers a range of benefits, including improved model accuracy, simplified interpretation of data, and the avoidance of bias and clustering problems. By implementing this method using one of several approaches and tools available in Python, researchers and analysts can gain deeper insights into complex data sets and achieve better outcomes in their projects.