Master the U-testing.
Unlock the power of Python to elevate your statistical analysis game as we delve into the intricacies of the Mann-Whitney U-Test! This robust, nonparametric test has established a commendable reputation in detecting significant differences between two independent data groups – and now it's your turn to join the ranks of savvy data scientists as you harness the ease and efficiency of Python.

Python Knowledge Base: Make coding great again.
- Updated:
2026-07-30 by Andrey BRATUS, Senior Data Analyst.
U-testing in statistics.
Assumptions of Mann-Whitney U-Test.
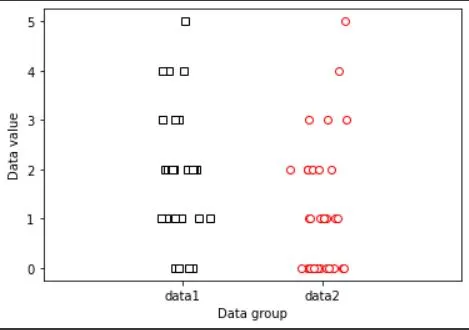
Generating initial data for Mann-Whitney u-test:
Mann-Whitney u-test using the Python scipy library:
Interpreting the Results.
Limitations of Mann-Whitney U-Test.
Conclusion.
The Mann-Whitney U-test (usually called U-test) is used to compare differences between two independent data groups which are not normally distributed.
The Mann-Whitney U test is often considered the nonparametric alternative to the independent t-test.
Scale of data measurements should be ordinal, interval or ratio.
The null hypothesis of the U-test is that the distribution underlying sample x is the same as the distribution underlying sample y.
Mann-Whitney U test is used for every field, but is frequently used in psychology, healthcare, nursing, business, and many other disciplines.
Before using the Mann-Whitney U-Test, there are several assumptions that must be met. Firstly, the samples being compared should be independent. This means that the observations in one sample should not influence the observations in the other sample. Secondly, the samples should be randomly selected to ensure that they are representative of the population. Additionally, the dependent variable being compared should be continuous. Lastly, the distributions for each sample should have equal shape and scale. Violating any of these assumptions may compromise the accuracy of the Mann-Whitney U-Test results. Therefore, it is important to ensure that these assumptions are met before proceeding with the test.
import matplotlib.pyplot as plt
import numpy as np
import scipy.stats as stats

# the data (different sample sizes)
N1 = 30
N2 = 35

data1 = np.random.poisson(2,N1)
data2 = np.random.poisson(1,N2)

plt.plot(1+np.random.randn(N1)/10,data1,'ks',markerfacecolor='w')
plt.plot(2+np.random.randn(N2)/10,data2,'ro',markerfacecolor='w')

plt.xlim([0,3])
plt.xticks([1,2],labels=('data1','data2'))
plt.xlabel('Data group')
plt.ylabel('Data value')
plt.show()
U,p = stats.mannwhitneyu(data1,data2)

print(U,p)
OUT: 320.0 0.0027477016627586097
After performing the Mann-Whitney U-Test with Python, the next step is to interpret the results. The p-value is the most important output of the Mann-Whitney U-Test. A p-value less than 0.05 indicates that there is a significant difference between the two groups being compared. On the other hand, a p-value greater than 0.05 suggests that there is no significant difference between the two groups.
Another important output is the effect size, which measures the magnitude of the difference between the two groups.
To compare the results of the Mann-Whitney U-Test, it is important to consider both the p-value and the effect size. A significant result with a large effect size indicates a strong difference between the two groups being compared. On the other hand, a significant result with a small effect size may indicate a difference that is not practically meaningful.
Interpreting the results of the Mann-Whitney U-Test can help to determine whether there is a significant difference between two groups. Understanding the p-value, effect size, and how to compare the results are all important steps in using the Mann-Whitney U-Test in statistical analysis.
Now that we understand the implementation of the Mann-Whitney U-Test with Python, it's important to note that this test also has its limitations. Firstly, the sample size needs to be sufficient for the results to be valid. Secondly, the test can only be used to analyze two groups. However, keeping these limitations in mind, the Mann-Whitney U-Test is still a powerful tool in statistical analysis that can provide valuable insights when used correctly. So, go ahead and give it a try in your next project!
In summary, Mann-Whitney U-Test is a vital tool in statistical analysis that can help make better decisions. I encourage readers to try implementing the Mann-Whitney U-Test with Python in their own projects. Trust me; it's worth it.