Quick dive into partial correlation.
Unlock the secrets of your data with Python! Dive deep into the world of analytics as we explore the exciting realm of partial correlation using Python. Perfect for statisticians, data scientists, and even the burgeoning script enthusiast, our step-by-step guide will shed light on how partial correlation measures the degree of association between two random variables, with the effect of an array of controlling random variables removed. Harness the versatility of Python to gain a new understanding of your data and amplify your analytics game.
Get ready to unravel intriguing data stories by leveraging Python's powerful data manipulation capabilities

Python Knowledge Base: Make coding great again.
- Updated:
2026-07-22 by Andrey BRATUS, Senior Data Analyst.
Partial correlation - removing the effect of other variables:
Partial correlation calculation - 3 datasets:
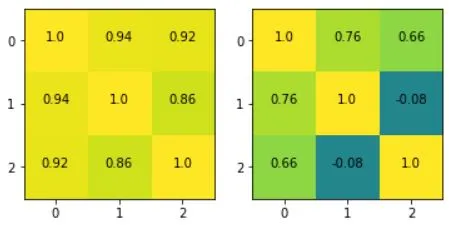
Visualizing the matrices - correlation VS partial correlation:
Applications of Partial Correlation in Data Science.
Conclusion.
Partial correlation is a vital statistical tool in the data scientist's kitbag. It enables us to identify the relationship between two variables, while controlling for the effect of one or more other variables.
Why is this important? Because often, there are a multitude of factors that can influence a particular dataset, and without being able to "tease out" the effect of each variable, we cannot hope to make accurate predictions.
Partial correlation measures the strength of a relationship or degree of association between two variables, while controlling/removing the effect of one or more other variables.
Partial correlation is used when correlation coefficient will give misleading results if there is another, confounding, variable that is numerically related to both variables of interest. This misleading information can be avoided by controlling for the confounding variable, which is done by computing the partial correlation coefficient.
Like the correlation coefficient, the partial correlation coefficient may take values in the range from –1 to 1 wiyh exactly the same interpretations:
- the value 1 tells a perfect positive linear relationship.
- the value – 1 tells a perfect negative correlation.
- the value 0 tells that there is no linear relationship.
import matplotlib.pyplot as plt
import numpy as np
import pandas as pd
import scipy.stats as stats

# pip install pingouin
import pingouin as pg


# raw correlations
rmg = .7
rsg = .8
rms = .9

# partial correlations
rho_mg_s = (rmg - rsg*rms) / ( np.sqrt(1-rsg**2)*np.sqrt(1-rms**2) )
rho_sg_m = (rsg - rmg*rms) / ( np.sqrt(1-rmg**2)*np.sqrt(1-rms**2) )

print(rho_mg_s)
print(rho_sg_m)
OUT:
-0.07647191129018778
0.5461186812727504
N = 76
# correlated datasets
x1 = np.linspace(1,10,N) + np.random.randn(N)
x2 = x1 + np.random.randn(N)
x3 = x1 + np.random.randn(N)
# let's convert these data to a pandas frame
df = pd.DataFrame()
df['x1'] = x1
df['x2'] = x2
df['x3'] = x3
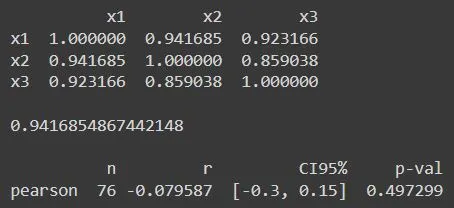
# compute the "raw" correlation matrix
cormatR = df.corr()
print(cormatR)
# print out one value
print(' ')
print(cormatR.values[1,0])
# partial correlation
pc = pg.partial_corr(df,x='x3',y='x2',covar='x1')
print(' ')
print(pc)
fig,ax = plt.subplots(1,2,figsize=(6,3))

# raw correlations
ax[0].imshow(cormatR.values,vmin=-1,vmax=1)
ax[0].set_xticks(range(3))
ax[0].set_yticks(range(3))

# add text
for i in range(3):
    for j in range(3):
        ax[0].text(i,j,np.round(cormatR.values[i,j],2), horizontalalignment='center')


# partial correlations
partialCorMat = df.pcorr()
ax[1].imshow(partialCorMat.values,vmin=-1,vmax=1)
ax[1].set_xticks(range(3))
ax[1].set_yticks(range(3))

for i in range(3):
    for j in range(3):
        ax[1].text(i,j,np.round(partialCorMat.values[i,j],2), horizontalalignment='center')


plt.show()
In data science, partial correlation is quite useful for feature selection and relationship identification in complex datasets. Feature selection using partial correlation helps in identifying the most important features that have a strong correlation with the target variable while controlling for the effect of other variables. This helps to avoid multicollinearity and overfitting, which can affect the accuracy of the model.
Relationship identification in complex datasets is also an important application of partial correlation. In complex datasets, there may be numerous variables, and it might be difficult to identify the true relationship between variables. By using partial correlation, we can remove the effect of confounding variables and identify the true relationship between the variables of interest. This helps in building more accurate and reliable models for predictive analytics.
In summary, Partial Correlation is a powerful tool for feature selection and relationship identification in complex datasets. Its future scopes are manifold. You can now add this tool to your armoury, and employ it to give you insights into data that might not have been possible otherwise.