Probabilities: quick dive.
Dive into the world of computing probabilities with Python, the versatile programming language that simplifies complex calculations and enhances your data analysis skills. In this comprehensive guide, you'll explore essential Python libraries and techniques tailored for probability computations, empowering you to tackle real-world problems with ease.

Python Knowledge Base: Make coding great again.
- Updated:
2026-07-14 by Andrey BRATUS, Senior Data Analyst.
Basic concepts of probabilities.
Python Libraries for computing probabilities.
Calculating probabilities for a number of events:
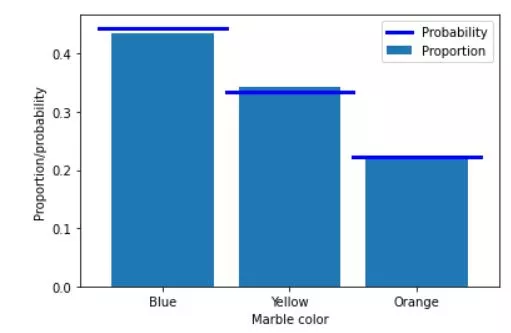
Calculating probabilities for drawing marbles from a jar:
10 real life applications of Probability theory.
Conclusion.
Whether you're a seasoned professional or a budding enthusiast, this resource will elevate your understanding of probability and equip you with the tools to make data-driven decisions confidently.
Probability is a branch of mathematics that studies uncertainty and randomness. It is used to describe the likelihood of an event or outcome. Probabilities are important because they help us make sense of the uncertain world around us. In this comprehensive guide, we'll provide a brief overview of computing probabilities with Python. Python is a powerful and popular programming language that has many libraries for working with probabilities and statistics. Let's dive in!
Probabilities are used to measure the likelihood of an event occurring. Events can range from flipping a coin to stock market predictions. Sample space refers to the set of all possible outcomes. Outcomes are the results of each event. There are three rules of probability: the sum of probabilities must equal 1, the probability of an event not occurring is 1 minus the probability of it occurring, and the probability of both events A and B occurring is the product of their individual probabilities.
Conditional probability refers to the likelihood of an event occurring given that another event has already occurred. It is calculated by dividing the probability of the intersection of the two events by the probability of the conditional event.
It is essential to understand the basic concepts of probability before moving on to more advanced topics, such as statistical inference and machine learning.
When it comes to computing probabilities with Python, there are a variety of Python libraries you can use to simplify your work. Some of these libraries include Python Probability Libraries, NumPy, and Pandas Libraries.
Python Probability Libraries provide a range of tools for statistical modelling and analysis. They are used for simple calculations and exploring complex datasets using probability-based methods. The NumPy and Pandas Libraries are particularly useful for data manipulation and feature extraction. These libraries allow for advanced data visualisation and statistical analysis.
Probability Distributions and Simulation are also important concepts to keep in mind when computing probabilities with Python. These concepts form the basis of many statistical simulation models. Simulation can help predict various outcomes from different variables, providing vital business insights for forecasting and decision making.
With these powerful libraries, probability distributions and simulation methods at your disposal, Python is a great tool to have in your data science toolkit.
import matplotlib.pyplot as plt
import numpy as np

## the basic formula

# counts of the different events
c = np.array([ 1, 2, 4, 3 ])

# convert to probability (%)
prob = 100*c / np.sum(c)
print(prob)
OUT: [10. 20. 40. 30.]
The following Python code shows probabilities and proportions calculation for case of drawing marbles of different colors - blue, yellow and orange - out of the box. It shows difference between probability and proportion and how far can it be depending the number of draws.
# colored marble counts
blue   = 40
yellow = 30
orange = 20
totalMarbs = blue + yellow + orange

# put them all in a jar
jar = np.hstack((1*np.ones(blue),2*np.ones(yellow),3*np.ones(orange)))

# now we draw 500 marbles (with replacement)
numDraws = 500
drawColors = np.zeros(numDraws)

for drawi in range(numDraws):

    # generate a random integer to draw
    randmarble = int(np.random.rand()*len(jar))

    # store the color of that marble
    drawColors[drawi] = jar[randmarble]

# now we need to know the proportion of colors drawn
propBlue = sum(drawColors==1) / numDraws
propYell = sum(drawColors==2) / numDraws
propOran = sum(drawColors==3) / numDraws


# plot those against the theoretical probability
plt.bar([1,2,3],[ propBlue, propYell, propOran ],label='Proportion')
plt.plot([0.5, 1.5],[blue/totalMarbs, blue/totalMarbs],'b',linewidth=3,label='Probability')
plt.plot([1.5, 2.5],[yellow/totalMarbs,yellow/totalMarbs],'b',linewidth=3)
plt.plot([2.5, 3.5],[orange/totalMarbs,orange/totalMarbs],'b',linewidth=3)

plt.xticks([1,2,3],labels=('Blue','Yellow','Orange'))
plt.xlabel('Marble color')
plt.ylabel('Proportion/probability')
plt.legend()
plt.show()
Weather forecasting: Probability theory helps meteorologists predict the likelihood of various weather conditions, such as rain, snow, or sunshine, based on historical data and atmospheric conditions.
Finance and investment: In the stock market, probability theory is used to assess the risk and potential return of investments, helping investors make informed decisions about their portfolios.
Insurance: Insurance companies rely on probability theory to calculate premiums and determine the likelihood of claims, ensuring they can cover payouts while remaining profitable.
Sports analytics: Probability theory is used to predict the outcomes of games and matches, helping coaches and teams develop strategies and make data-driven decisions.
Medicine: In medical research, probability theory is used to analyze the effectiveness of treatments and the likelihood of side effects, guiding the development of new drugs and therapies.
Quality control: Manufacturers use probability theory to assess the likelihood of defects in products and implement quality control measures to minimize errors.
Traffic management: Probability theory helps transportation planners predict traffic patterns and optimize traffic flow, reducing congestion and improving safety on roads.
Natural disaster prediction: Scientists use probability theory to estimate the likelihood of earthquakes, volcanic eruptions, and other natural disasters, aiding in preparedness and risk management.
Artificial intelligence: Probability theory plays a crucial role in machine learning algorithms, helping AI systems make predictions and decisions based on data patterns.
Social sciences: Researchers in fields like psychology, sociology, and economics use probability theory to analyze data and draw conclusions about human behavior and decision-making processes.
In conclusion, computing probabilities with Python is an essential tool for a wide range of applications in diverse fields such as stock prediction, gambling analysis, and machine learning. Probability rules, conditional probability, python libraries, probability plots, and statistical inference are the fundamental concepts discussed in this post. Python libraries such as Pandas and Numpy simplify probability computations, enable the simulation of probability distributions, and help with plotting histograms and box plots. Understanding probabilities and their computations with Python is vital in solving complex problems and making informed decisions.