Data cleaning.
Discover the power of Z-Score Outliers Removal in Python, your ultimate solution for identifying and eliminating pesky outliers that can skew your data analysis. Dive into the world of statistical algorithms and learn how to harness the potential of Python's robust libraries to clean your datasets with precision. Unleash the full potential of your data by mastering the art of Z-Score Outliers Removal, and embark on a journey towards more accurate and insightful data-driven decision-making.
Welcome to the realm where data quality reigns supreme!

Python Knowledge Base: Make coding great again.
- Updated:
2026-07-20 by Andrey BRATUS, Senior Data Analyst.
Understanding Z-Scores.
Identifying Z-Score Outliers.
Removing Z-Score Outliers.
Creating and plotting the data in Python:
Identifying the outliers:
Iterative method:
Modified Z for non-normal distributions:
Limitations of Removing Z-Score Outliers.
Conclusion:
In adiition and alternative to simple dataset cleaning technique described in Machine learning and Data science section, more advanced method can be used which uses Z-score to filter outliers.
The Z-score method can be applied for data which is normally-like distributed, for other types of data distribution modified Z-score method should be applied.
Z-Scores are standardized values that help to interpret data. They measure how many standard deviations a datapoint is from the mean of the dataset. A Z-Score of 0 indicates that the data point is the same as the mean, while a Z-Score of 1 indicates that the data point is 1 standard deviation away from the mean, and so on.
Calculating Z-Scores is simple. First, subtract the mean from the data point value, then divide it by the standard deviation. The resulting value is the Z-Score.
While Z-Scores may seem confusing at first, they are an incredibly useful tool for analyzing and visualizing data. Plus, the math involved is a great way to make your brain work and feel smart (if that's your thing). Don't worry if you don't get it right away, just keep practicing and soon Z-Scores will become second nature.
Z-Score outliers are the data points that deviate significantly from the mean. These outliers have a Z-score greater than 3 or less than -3 and are considered to be extreme values. These values can provide meaningful insights into the data if they represent an actual event. However, if these values are due to errors or measurement problems, they can distort the interpretation of the entire data set.
It's essential to identify Z-score outliers because they can skew the mean, standard deviation, and other statistical analysis results. They can also affect the normal distribution of the data, making it difficult to apply parametric tests.
To overcome these challenges, one can use Boxplots or Scatterplots to visually identify the outliers. Another way is to calculate the Z-Scores of each data point and compare them with the threshold value of 3 or -3.
Remember, blindly removing Z-score outliers can result in the loss of crucial information. Therefore, it's necessary to analyze and determine the cause of these outliers before taking any actions.
Are you tired of dealing with extreme values in your data? Look no further than removing Z-score outliers! This process involves identifying data points that are considered too far from the average and removing them from your dataset.
To remove Z-score outliers, you first need to calculate the Z-scores of your data points. Next, you can set a threshold for which values are considered outliers. A common threshold is any Z-score value above 3. Once you have identified the outliers, you can choose to either remove them completely or replace them with more typical values.
Some techniques for removing Z-score outliers include Winsorizing, trimming, and using the interquartile range. Winsorizing involves replacing extreme values with the next highest or lowest value within the dataset. Trimming, on the other hand, involves completely removing the outliers. Using the interquartile range involves identifying values outside of the IQR and then Winsorizing or trimming those values accordingly.
Although removing Z-score outliers can be helpful in cleaning up your data, it’s important to use this technique thoughtfully and not indiscriminately. Be sure to consider the impact of removing outliers on your overall dataset and be aware of potential limitations, such as overfitting the remaining data.
So give it a shot and remove those pesky outliers – your data will thank you!
import numpy as np
import matplotlib.pyplot as plt
from statsmodels import robust
import scipy.stats as stats
N = 40
data = np.random.randn(N)
data[data<-1] = data[data<-1]+2
data[data>2] = data[data>2]**2; # try to force a few outliers
data = data*200 + 50 # change the scale for comparison with z
# convert to z
dataZ = (data-np.mean(data)) / np.std(data)
#### specify the z-score threshold
zscorethresh = 3
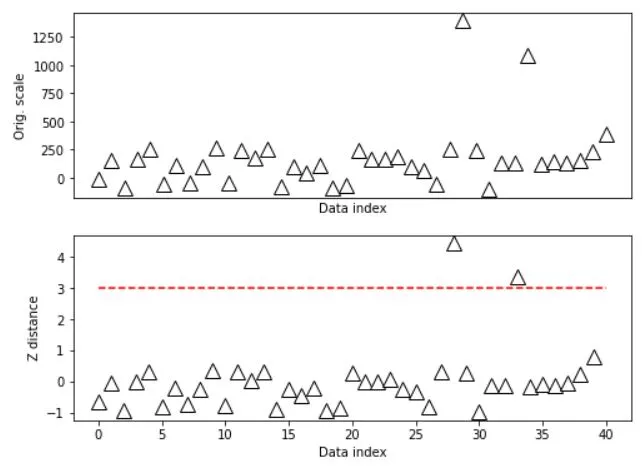
# plot the data
fig,ax = plt.subplots(2,1,figsize=(8,6))
ax[0].plot(data,'k^',markerfacecolor='w',markersize=12)
ax[0].set_xticks([])
ax[0].set_xlabel('Data index')
ax[0].set_ylabel('Orig. scale')
# then plot the zscores
ax[1].plot(dataZ,'k^',markerfacecolor='w',markersize=12)
ax[1].plot([0,N],[zscorethresh,zscorethresh],'r--')
ax[1].set_xlabel('Data index')
ax[1].set_ylabel('Z distance')
plt.show()
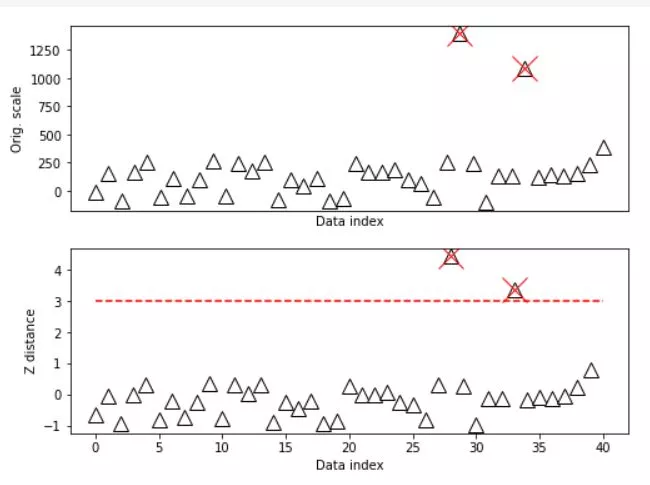
outliers = np.where(abs(dataZ)>zscorethresh)[0]

# and cross those out
ax[0].plot(outliers,data[outliers],'x',color='r',markersize=20)
ax[1].plot(outliers,dataZ[outliers],'x',color='r',markersize=20)

fig
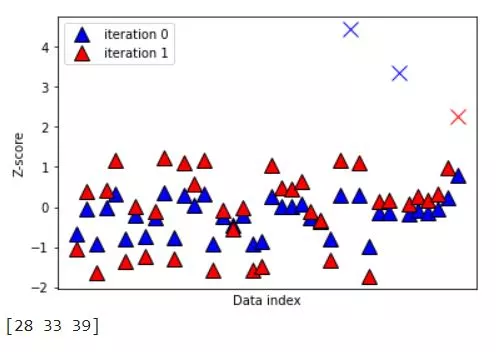
Sometimes one round of cleaning dataset is not enough and it is possible to aaply Z-score method in several iterations. IMPORTANT !: choose the threshold wisely depending on data (usually between 3 and 2).
# choose the threshold
zscorethresh = 2
dataZ = (data-np.mean(data)) / np.std(data)


colorz = 'brkm'
numiters = 0 # iteration counter
while True:

    # convert to z
    datamean = np.nanmean(dataZ)
    datastd  = np.nanstd(dataZ)
    dataZ = (dataZ-datamean) / datastd

    # find data values to remove
    toremove = dataZ>zscorethresh

    # break out of while loop if no points to remove
    if sum(toremove)==0:
        break
    else:
        # otherwise, mark the outliers in the plot
        plt.plot(np.where(toremove)[0],dataZ[toremove],'%sx'%colorz[numiters],markersize=12)
        dataZ[toremove] = np.nan

    # replot
    plt.plot(dataZ,'k^',markersize=12,markerfacecolor=colorz[numiters],label='iteration %g'%numiters)
    numiters = numiters + 1

plt.xticks([])
plt.ylabel('Z-score')
plt.xlabel('Data index')
plt.legend()
plt.show()

#### the data points to be removed
removeFromOriginal = np.where(np.isnan(dataZ))[0]
print(removeFromOriginal)
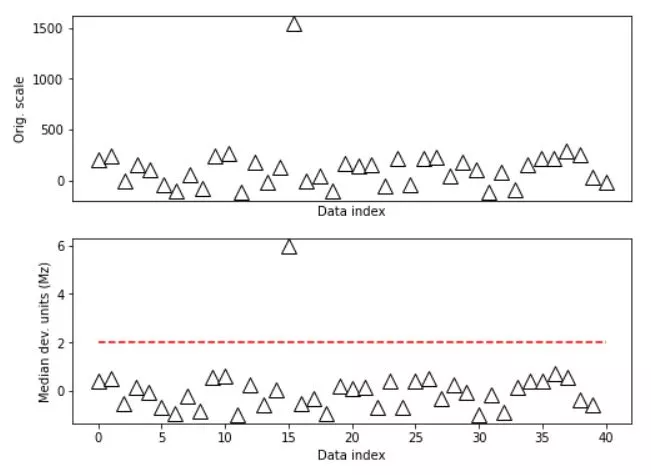
For non-normal distribution data modified Z-score method should be applied.
# compute modified z
dataMed = np.median(data)
dataMAD = robust.mad(data)

dataMz = stats.norm.ppf(.75)*(data-dataMed) / dataMAD


# plot the data
fig,ax = plt.subplots(2,1,figsize=(8,6))

ax[0].plot(data,'k^',markerfacecolor='w',markersize=12)
ax[0].set_xticks([])
ax[0].set_xlabel('Data index')
ax[0].set_ylabel('Orig. scale')

# then plot the zscores
ax[1].plot(dataMz,'k^',markerfacecolor='w',markersize=12)
ax[1].plot([0,N],[zscorethresh,zscorethresh],'r--')
ax[1].set_xlabel('Data index')
ax[1].set_ylabel('Median dev. units (Mz)')
plt.show()
We all love to identify anomalies in data, especially when they seem to significantly deviate from the norm. Z-Score outliers are one such anomaly that could bring a lot of noise into an otherwise clean data set. However, like everything else in life, removal of Z-Score outliers comes with a few cautions.
If a data set is small, removing outliers could impact the integrity of the entire data set. Under certain circumstances, these outliers may be the most crucial part of your data. Secondly, Z-Score outliers may not always be an indication of an error. Removing these outliers without proper justification could lead to loss of valuable data points.
Furthermore, as the usual methods for detecting Z-Score outliers rely on mean and standard deviation, it is not always appropriate to use them with non-continuous data. Additionally, removing Z-Score outliers could result in a significant shift in the key parameters of your data, including the mean and median values.
Therefore, it is essential to evaluate your data set and the context behind the outliers before deciding to eliminate them. This will ensure that the data you work with has the right balance of information and reliability.
To summarize, removing Z-Score outliers is crucial for accurate data analysis. Implementing various techniques like mean and standard deviation, replacing with mean values, etc., can help remove outliers effectively. It's important to handle outliers carefully and take their impact into account before removing them.