Cosine similarity in statistics.
If you're looking to uncover the similarities between documents, vectors, or any other data points, you've come to the right place. Cosine similarity is a popular metric used in natural language processing, information retrieval, and recommendation systems. By measuring the cosine of the angle between two vectors, it provides a valuable measure of similarity. In this guide, we'll take you through the theory behind cosine similarity, show you how to calculate it using Python, and provide practical examples to help you apply it in real-world scenarios.
Get ready to dive into the world of cosine similarity and unlock the power of measuring similarities with Python.

Python Knowledge Base: Make coding great again.
- Updated:
2026-07-18 by Andrey BRATUS, Senior Data Analyst.
Cosine similarity VS classical correlation:
Correlation between Cosine similarity and classical correlation:
Working with Real-World Examples.
Conclusion.
In statistics world cosine similarity is the cosine of the angle between two n-dimensional vectors in an n-dimensional space. It is the dot product of the two vectors divided by the product of the two vectors' lengths (or magnitudes).
Mathematically, it measures the cosine of the angle between two vectors projected in a multi-dimensional space.
The smaller the angle between two vectors, the higher the cosine similarity. The cosine similarity depends only on the angle between the two non-zero vectors, but not on their magnitudes.
The cosine similarity can be used together with classical correlation to undersatnd relation between data, results are very close when data are equally mean-centered and differ otherwise, intuition between calculated values are very similar to classical correlation.
import matplotlib.pyplot as plt
import numpy as np
from scipy import spatial

# range of requested correlation coefficients
rs = np.linspace(-1,1,100)

# sample size
N = 500


# initialize output matrix
corrs = np.zeros((len(rs),2))


# loop over a range of r values
for ri in range(len(rs)):

    # generate data
    x = np.random.randn(N)
    y = x*rs[ri] + np.random.randn(N)*np.sqrt(1-rs[ri]**2)

    # optional mean-off-centering
    x = x+1
    #y = y+10


    # compute correlation
    corrs[ri,0] = np.corrcoef(x,y)[0,1]

    # compute cosine similarity
    cs_num = sum(x*y)
    cs_den = np.sqrt(sum(x*x)) * np.sqrt(sum(y*y))
    corrs[ri,1] = cs_num / cs_den

    # using built-in distance function
    #corrs[ri,1] = 1-spatial.distance.cosine(x,y)

  ## visualize the results

plt.plot(rs,corrs[:,0],'s-',label='Correlation')
plt.plot(rs,corrs[:,1],'s-',label='Cosine sim.')
plt.legend()
plt.xlabel('Requested correlation')
plt.ylabel('Empirical correlation')
plt.axis('square')
plt.show()


plt.plot(corrs[:,0],corrs[:,1],'ks')
plt.axis('square')
plt.xlabel('Correlation')
plt.ylabel('Cosine similarity')
plt.show()
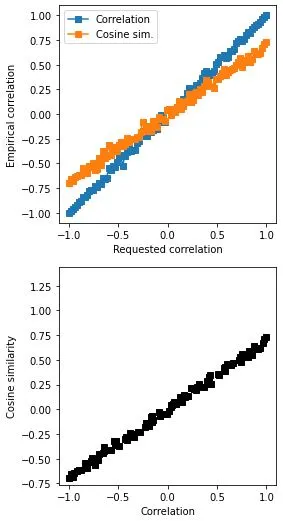
# their empirical correlation
np.corrcoef(corrs.T)
OUT:
array([[1. , 0.99772192],
[0.99772192, 1. ]])
Want to see how Cosine Similarity works in the real world? Of course, you do! Let's dive into a couple of examples that will show you just how powerful this concept can be.
Example 1: Document Similarity
Imagine you have a massive collection of documents, and you want to find out which ones are most similar to each other. With Cosine Similarity, you can calculate the cosine angle between the document vectors to determine their similarity. The closer the angle is to 0, the more similar the documents are. This technique is widely used in the field of text analysis, and with Python and Cosine Similarity, you can easily implement it in your own projects.
Example 2: Movie Recommendation
Are you tired of searching for movies to watch? Cosine Similarity can come to your rescue! By using the vector representation of movies based on their features, such as actors, genre, and ratings, you can calculate the cosine similarity between movies. This allows you to recommend similar movies to users based on their preferences. So, the next time you can't decide what to watch, just let Cosine Similarity and Python do the work for you!
Now that you've seen some exciting real-world examples, you can unleash the power of Cosine Similarity in your own data science projects. Python makes it easy to implement and with a little creativity, you can adapt it to various applications.
So, get ready to harness the power of statistics and data science with Cosine Similarity and Python. It's time to take your data analysis skills to the next level!
Cosine similarity is a crucial concept in data science, enabling us to measure the similarity between vectors. With Python, we can easily implement this technique and leverage the power of statistics for various applications. So, next time you encounter a recommendation system or need to analyze text data, remember to consider cosine similarity as a handy tool. Happy coding!