One-sample testing quick dive.
Welcome to your ultimate guide on the one-sample t-test with Python. Whether you're a seasoned data analyst or a beginner in the field, understanding the power of statistical tests is crucial. The one-sample t-test, a fundamental tool in Python, is a game-changer when it comes to interpreting data and making informed decisions. This guide will walk you through the process of implementing this statistical test in Python, breaking down complex concepts into easy-to-understand steps. By the end of this guide, you'll be able to confidently apply the one-sample t-test to your data analysis projects, unlocking new insights and enhancing your data interpretation skills.

Python Knowledge Base: Make coding great again.
- Updated:
2026-07-14 by Andrey BRATUS, Senior Data Analyst.
Generate the data for one-sample t-test:
Manual t-test - long way:
T-test using the Python function - best way:
Interpretation of results.
Assumptions of One-Sample t-Test.
Conclusion.
Sometimes you might want to know how your sample mean compares to the population mean. In that case you need one-sample t-test which is a statistical hypothesis test used to determine whether an unknown population mean is different from a specific value.
You usually run a one sample t test when you don't know the population standard deviation or you have a small sample size.
For this test there should be no significant outliers in data and dependent variable should be approximately normally distributed.
Also the data must be independent (i.e., not correlated), which means that there is no relationship between the observations.
import matplotlib.pyplot as plt
import numpy as np
import scipy.stats as stats
# parameters
N = 20 # sample size
popMu = .5 # true population mean
data = np.random.randn(N) + popMu
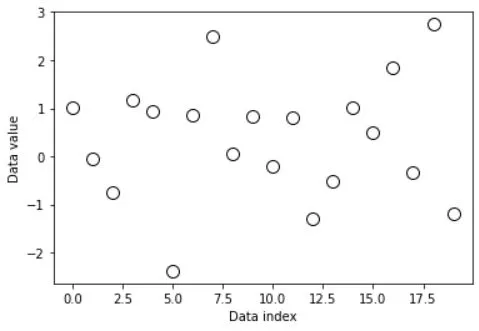
# let's see what the data look(s) like
plt.plot(data,'ko',markerfacecolor='w',markersize=10)
plt.xlabel('Data index')
plt.ylabel('Data value')
plt.show()
# the null-hypothesis value
H0val = 0
# compute the t-value
t_num = np.mean(data) - H0val
t_den = np.std(data, ddof=1) / np.sqrt(N)
tval = t_num / t_den
# degrees of freedom
df = N-1
# p-value
pval = 1-stats.t.cdf(abs(tval),df)
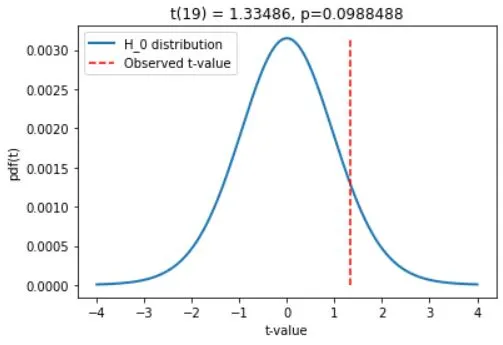
# show the H0 parameter distribution and observed t-value
x = np.linspace(-4,4,1001)
tdist = stats.t.pdf(x,df) * np.mean(np.diff(x))
plt.plot(x,tdist,linewidth=2)
plt.plot([tval,tval],[0,max(tdist)],'r--')
plt.legend(('H_0 distribution','Observed t-value'))
plt.xlabel('t-value')
plt.ylabel('pdf(t)')
plt.title('t(%g) = %g, p=%g'%(df,tval,pval))
plt.show()
IMPORTANT: please note that Python function gives p-value for two-tailed test, compare to manual method !!!
t,p = stats.ttest_1samp(data,H0val)

print(t,p)
OUT: 1.334861245367219 0.19769758234172718
After conducting the One-Sample t-Test, the next step is to interpret the results to answer the research question. The first element to consider is the calculated t-statistic, which measures the difference between the sample mean and hypothesized value for the population mean. A larger absolute value of t indicates a larger discrepancy between our sample mean and the hypothesized value.
The p-value represents the probability of obtaining the observed sample mean under the assumption that the null hypothesis is true. If the p-value is less than the significance level (usually 0.05), we reject the null hypothesis and accept the alternative hypothesis. However, if the p-value is greater than the significance level, we fail to reject the null hypothesis.
It's essential to keep in mind the practical significance of the results, not just the statistical significance. We need to ask ourselves if the difference observed in the sample is meaningful in a real-world context. Are the results large enough to have practical significance and impact?
Overall, interpreting the results of a One-Sample t-Test requires assessing the statistical significance, practical significance and considering the research question. By doing so, we can draw meaningful conclusions and recommendations based on the data.
Assumptions of One-Sample t-Test: To conduct a One-Sample t-Test, we need to satisfy three key assumptions. Firstly, the data we have must be normally distributed. Secondly, the observations should be independent of each other, i.e., the data in the sample should not be related to each other. Lastly, the sample size should not be too small. These assumptions are crucial as they ensure the validity of the test. Violation of any of these assumptions can lead to false results. Therefore, it is essential to check if the data satisfies these assumptions before conducting the test to avoid any erroneous conclusions.
In summary, the One-Sample t-Test can provide valuable insights into the population mean, and can be used to test hypotheses and make predictions about future outcomes.
In research, the One-Sample t-Test is an important statistical analysis that helps researchers make decisions based on data. It is a valuable tool in many fields, including business, psychology, and biology. By using the One-Sample t-Test with Python, researchers can get a better understanding of their data and make more informed decisions.
However, like any statistical test, the One-Sample t-Test has limitations. It requires certain assumptions to be met, such as the normality of data, independence of observations, and sample size. It is also limited to analyzing data from a single sample. Future research could explore ways to address these limitations and improve the accuracy and applicability of the One-Sample t-Test.
Overall, the One-Sample t-Test with Python is a powerful tool for analyzing data and making decisions based on data-driven insights. It has important applications in research and can help researchers make more informed decisions. However, it is important to understand its limitations and consider alternative methods when necessary.