Conditional probability in statistics.
Unlock the power of Python to master the intriguing world of Conditional Probability! As you embark on this exciting journey, you'll discover how Python, a versatile and widely-used programming language, can simplify and streamline your understanding of conditional probability. This dynamic duo of Python and Probability is not just about crunching numbers; it's about unveiling the hidden patterns in data, predicting future events, and making informed decisions.

Python Knowledge Base: Make coding great again.
- Updated:
2026-07-18 by Andrey BRATUS, Senior Data Analyst.
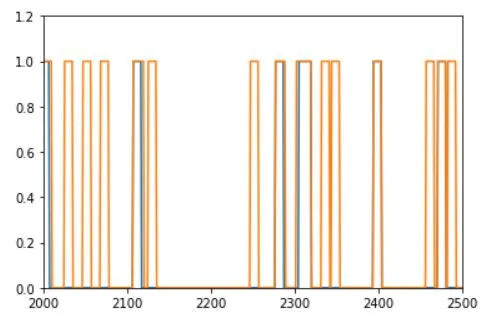
Generating two time series:
Compute series probabilities and intersection:
Compute the conditional probabilities:
Applications of Conditional Probability in Python.
Limitations of Conditional Probability in Python.
Conclusion.
Whether you're a seasoned data scientist, a budding statistician, or a curious beginner, our 'Python for Conditional Probability' guide is your key to unlocking the mysteries of probability in a practical, Pythonic way. Dive in, and let's decode the secrets of data together!
Conditional probability is actually the likelihood of an event or outcome occurring, based on the occurrence of a previous event or outcome.
Conditional probability has many applications such as Data science, insurance, politics, and many different fields of mathematics.
Conditional probability can be contrasted with unconditional probability.
Unconditional probability refers to the likelihood that an event will take place irrespective of whether any other events have taken place or any other conditions are present.
Probabilities are classified as either conditional, marginal, or joint.
Conditional probability: p(A|B) is the probability of event A occurring, given that event B occurs.
Marginal probability: Marginal probability is the probability of an event irrespective of the outcome of another variable.
Joint probability: p(A and B). The probability of event A and event B occurring. It is the probability of the intersection of two or more events. The probability of the intersection of A and B may be written p(A ∩ B).
import matplotlib.pyplot as plt
import numpy as np

N = 10000
spikeDur  = 10  # a.u. but must be an even number
spikeNumA = .01 # in proportion of total number of points
spikeNumB = .05 # in proportion of total number of points

# initialize to zeros
spike_tsA = np.zeros(N)
spike_tsB = np.zeros(N)


### populate time series A
spiketimesA = np.random.randint(0,N,int(N*spikeNumA))

# flesh out spikes (loop per spike)
for spikei in range(len(spiketimesA)):

    # find boundaries
    bnd_pre = int( max(0,spiketimesA[spikei]-spikeDur/2) )
    bnd_pst = int( min(N,spiketimesA[spikei]+spikeDur/2) )

    # fill in with ones
    spike_tsA[bnd_pre:bnd_pst] = 1


# ### repeat for time series 2
spiketimesB = np.random.randint(0,N,int(N*spikeNumB))
spiketimesB[:len(spiketimesA)] = spiketimesA # induce strong conditional probability

# flesh out spikes (loop per spike)
for spikei in range(len(spiketimesB)):

    # find boundaries
    bnd_pre = int( max(0,spiketimesB[spikei]-spikeDur/2) )
    bnd_pst = int( min(N,spiketimesB[spikei]+spikeDur/2) )

    # fill in with ones
    spike_tsB[bnd_pre:bnd_pst] = 1

plt.plot(range(N),spike_tsA, range(N),spike_tsB)
plt.ylim([0,1.2])
# plt.xlim([2000,2500])
plt.show()
It is often stated as the probability of B given A and is written as P(B|A), where the probability of B depends on that of A happening.
Where:
P = Probability
A = Event A
B = Event B
# probabilities
probA = sum(spike_tsA==1) / N
probB = np.mean(spike_tsB)

# joint probability
probAB = np.mean(spike_tsA+spike_tsB==2)

print(probA,probB,probAB)
OUT: 0.0927 0.3958 0.0927
# p(A|B)
pAgivenB = probAB/probB

# p(B|A)
pBgivenA = probAB/probA

# print a little report
print('P(A)   = %g'%probA)
print('P(A|B) = %g'%pAgivenB)
print('P(B)   = %g'%probB)
print('P(B|A) = %g'%pBgivenA)
OUT:
P(A) = 0.0927
P(A|B) = 0.234209
P(B) = 0.3958
P(B|A) = 1
Now that we know how to apply conditional probability with Python, let's take a look at some of its applications. Conditional probability is used extensively in the fields of medical diagnosis, stock market predictions, and marketing analysis.
In medical diagnosis, conditional probability is used to determine the probability of a patient having a certain disease given their symptoms. This can be a lifesaver for patients as it helps doctors make a more accurate diagnosis and provide timely treatment.
Moving on to stock market predictions, conditional probability can be used to predict the likelihood of a stock's value increasing or decreasing based on various factors such as economic indicators, company performance, and market trends. This helps investors make informed decisions and minimize risks while investing in the stock market.
Finally, in marketing analysis, conditional probability is used to analyze customer behavior and preferences, allowing companies to make targeted advertising campaigns and maximize their profits.
However, it's important to note that conditional probability has its limitations, such as simplifying assumptions, intuition-based decisions, and difficulty with causality. This means that while it can provide valuable insights, it should not be used as the sole basis for decision making.
In conclusion, understanding conditional probability in Python can provide useful insights in a diverse array of fields and is definitely worth exploring.
Conditional probability in Python has some limitations that should be acknowledged. One limitation is the need for simplifying assumptions, which can oversimplify real-world problems. Another limitation is the risk of intuition-based decisions, relying on limited data to make judgments. Finally, there is a difficulty with causality, as correlation does not always imply causation. These limitations highlight the importance of proper data analysis and interpretation, as well as the need for caution when drawing conclusions from statistical models. However, Python libraries offer some solutions to these limitations, providing advanced tools for statistical analysis and data visualization. By leveraging these libraries and continuing to refine methods for data analysis, Python can continue to be a valuable tool for conditional probability in a wide range of applications.
In summary, Python is a powerful language for working with conditional probability. With the help of libraries like NumPy, Pandas, and Matplotlib, we can apply Bayesian analysis and conditional probability distributions in various fields such as medical diagnoses, stock market predictions, and marketing analysis. However, it's important to remember that simplifying assumptions, intuition-based decisions, and difficulty with causality are limitations when using conditional probability in Python. The future of conditional probability in Python looks bright, and we can expect more sophisticated techniques to be developed, but it's crucial to use it with caution and critical thinking.