Two-sample testing quick dive.
Dive into the world of statistical analysis as we meticulously unravel the process of executing a two-sample t-test using Python. This powerful statistical technique is crucial for comparing two independent data groups and finding meaningful insights. Whether you're a seasoned data analyst or a Python newbie, our in-depth guide caters to everyone who's keen to up their statistical testing game. You will not only understand the concept and mathematical basis of the t-test but will also become implementing it with Python - the language renowned for its efficiency in data analysis and machine learning tasks.

Python Knowledge Base: Make coding great again.
- Updated:
2026-07-19 by Andrey BRATUS, Senior Data Analyst.
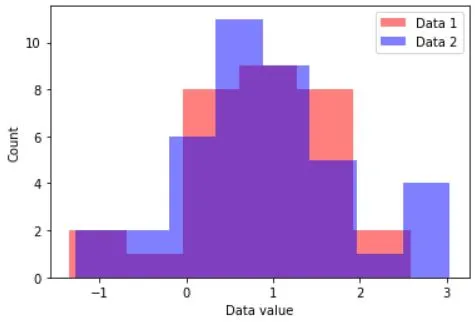
Generate the data for two-sample t-test:
T-test using the Python scipy library:
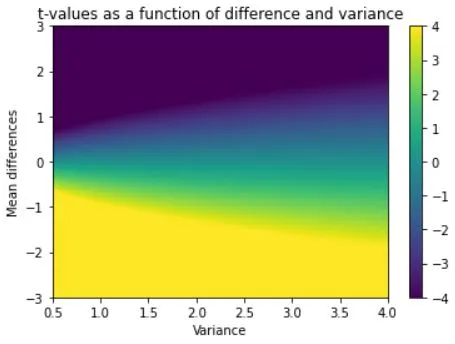
T-values depending means difference and variance:
Assumptions of the Two-Sample T-Test.
Interpreting the results.
Conclusion.
The two-sample t-test (or independent samples t-test) is one of the most commonly used hypothesis tests which applied to compare whether the average difference between two groups is really significant.
Two-sample means that we have 2 sets of samples.
The formula itself used in Python stats library may differ depending if two data groups are paired or unpaired, with equal or unequal varianse and equal or unequal sample sizes.
So chosing correct formula depending on tested data nature is important. But surely 1 common part of each formula is nemerator which is a data groups means differense.
Paired means that both samples consist of the same test subjects, e g testing group of students before and after taking drugs.
Unpaired means that both samples consist of distinct test subjects, e g testing group of students taking drugs and reference group of students.
It is a common assuption that if we have the ratio of the larger variance to the smaller variance less than 4, we can assume the variances are approximately equal.
import matplotlib.pyplot as plt
import numpy as np
import scipy.stats as stats

# parameters
n1 = 30   # samples in dataset 1
n2 = 40   # ...and 2
mu1 = 1   # population mean in dataset 1
mu2 = 1.2 # population mean in dataset 2


# generate the data
data1 = mu1 + np.random.randn(n1)
data2 = mu2 + np.random.randn(n2)

# show their histograms
plt.hist(data1,bins='fd',color=[1,0,0,.5],label='Data 1')
plt.hist(data2,bins='fd',color=[0,0,1,.5],label='Data 2')
plt.xlabel('Data value')
plt.ylabel('Count')
plt.legend()
plt.show()
t,p = stats.ttest_ind(data1,data2,equal_var=True)

df = n1+n2-2
print('t(%g) = %g, p=%g'%(df,t,p))
OUT: t(68) = 0.0974228, p=0.922677
# ranges for t-value parameters
meandiffs = np.linspace(-3,3,80)
pooledvar = np.linspace(.5,4,100)

# group sample size
n1 = 40
n2 = 30

# initialize output matrix
allTvals = np.zeros((len(meandiffs),len(pooledvar)))

# loop over the parameters...
for meani in range(len(meandiffs)):
    for vari in range(len(pooledvar)):

        # t-value denominator
        df = n1 + n2 - 2
        s  = np.sqrt(( (n1-1)*pooledvar[vari] + (n2-1)*pooledvar[vari]) / df)
        t_den = s * np.sqrt(1/n1 + 1/n2)

        # t-value in the matrix
        allTvals[meani,vari] = meandiffs[meani] / t_den


plt.imshow(allTvals,vmin=-4,vmax=4,extent=[pooledvar[0],pooledvar[-1],meandiffs[0],meandiffs[-1]],aspect='auto')
plt.xlabel('Variance')
plt.ylabel('Mean differences')
plt.colorbar()
plt.title('t-values as a function of difference and variance')
plt.show()
Before performing the Two-Sample T-Test, we need to make sure that the data meets specific assumptions. Firstly, the data should be normally distributed, which means that it should follow the normal bell-shaped curve. We can check this assumption by plotting the data or using normality tests like the Shapiro-Wilk test. Secondly, the two groups compared in the T-Test should have equal variances. Equal variance assumption can be checked by performing the Levene's test. Lastly, the two groups should be independent.
Meeting these assumptions is crucial for the validity and accuracy of the test. If the data violates any of these assumptions, then we cannot rely on the results of the Two-Sample T-Test. So, be sure to check these assumptions before applying the T-Test.
Interpreting the results of the T-Test is crucial. The results would be in the form of t-statistic value and p-value. The t-statistic value depicts the difference between the means of the two datasets, while the p-value measures the significance of this difference. A low p-value indicates a significant difference between the two datasets, whereas a high p-value would indicate otherwise.
It's essential to note that statistical significance doesn't necessarily mean practical significance. It's up to the analyst to interpret the results based on their context.
In conclusion, understanding the Two-Sample T-Test with Python is crucial for making informed decisions based on data. With the right assumptions, libraries, and techniques, you can apply this method to various scenarios. Happy analyzing!