ANOVA in statistics.
As an integral part of data science, understanding One-way ANOVA, aka Analysis of Variance, can drastically refine your skills. Our guide meticulously explicates the steps for conducting One-way ANOVA in Python, making complex statistical analysis accessible and straightforward to data enthusiasts, beginners, and professionals alike. Start your journey and uncover the potential of Python as a robust tool for your data analysis tasks.

Python Knowledge Base: Make coding great again.
- Updated:
2026-07-21 by Andrey BRATUS, Senior Data Analyst.
One-way ANOVA - simulating data:
Generating the ANOVA table:
Performing the Tukey test:
One-way ANOVA - visualizing the means differences:
Real-Life Examples of One-Way ANOVA.
Limitations of One-Way ANOVA.
Conclusion.
Analysis of variance (ANOVA) is a statistical method that is usually used to check if the means of two or more groups are significantly different from each other. ANOVA checks the impact of one or more factors by comparing the means of different samples.
TSS = SSE + RSS = Within_group_variability + Between_group_variability
Total Variation → TSS = Total Sum of Squares
Unexplained Variation → SSE = Sum of Squared Errors
Explained Variation → RSS = Regression Sum of Squares
The statistic which measures if the means of different samples are really (significantly) different or not is called the F-Ratio. Lower the F-Ratio, more similar are the sample means. In that case, we cannot reject the null hypothesis.If no true variance exists between the groups, the ANOVA's F-ratio should equal close to 1.
F = Between_group_variability / Within_group_variability
A one-way ANOVA lets us know that at least two groups are different from each other. But it won’t tell us which groups are different. If our test returns a significant f-statistic, we may need to run a post-hoc test to tell us exactly which groups have a difference in means.
import numpy as np
import matplotlib.pyplot as plt
import pingouin as pg
import pandas as pd
## data parameters
# group means
mean1 = 4
mean2 = 3.8
mean3 = 7
# samples per group
N1 = 30
N2 = 35
N3 = 29
# standard deviation (assume common across groups)
stdev = 2
## now to simulate the data
data1 = mean1 + np.random.randn(N1)*stdev
data2 = mean2 + np.random.randn(N2)*stdev
data3 = mean3 + np.random.randn(N3)*stdev
datacolumn = np.hstack((data1,data2,data3))
# group labels
groups = ['1']*N1 + ['2']*N2 + ['3']*N3
# convert to a pandas dataframe
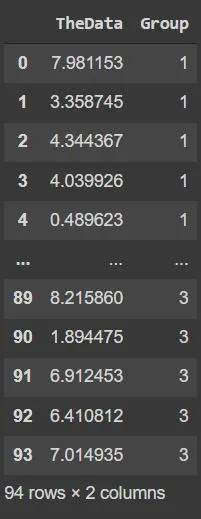
df = pd.DataFrame({'TheData':datacolumn,'Group':groups})
df
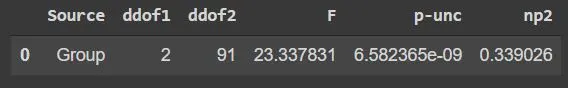
pg.anova(data=df,dv='TheData',between='Group')
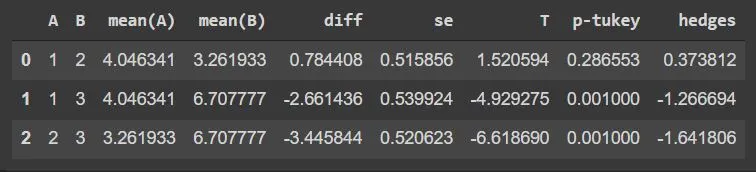
pg.pairwise_tukey(data=df,dv='TheData',between='Group')
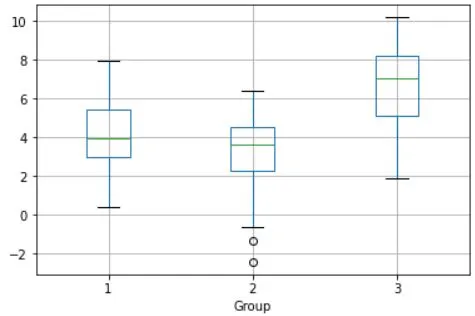
df.boxplot('TheData',by='Group');
Real-Life Example 1 - Comparing Average Salaries:
Who doesn't love talking about money? With One-Way ANOVA, we can compare the average salaries of different job positions and see if there are any significant differences. It's like a battle of the paychecks!
Real-Life Example 2 - Evaluating Product Quality:
Imagine you're a quality control manager at a chocolate factory. You conduct a one-way ANOVA to compare the cocoa content in different batches of chocolates. By analyzing the data, you determine the variation in cocoa content and identify potential quality issues. This helps you ensure that every bite of chocolate is a delightful experience for consumers. So, next time you indulge in a sweet treat, thank ANOVA for its role in maintaining product quality!
Real-Life Example 3 - Analyzing Test Scores:
Imagine a scenario where we have three different teaching methods (Traditional, Montessori, and Online) and we want to determine if they have any significant impact on student performance on a standardized test. By conducting a One-Way ANOVA, we can analyze the data and uncover if there's a teaching method that stands out from the rest.
Brace yourselves, folks, because this statistical tool may not always be your knight in shining armor. Firstly, One-Way ANOVA assumes that the data is normally distributed, and let's face it, life isn't always so straightforward. Additionally, it requires homogeneity of variances, meaning that the groups being compared should have similar variances. But hey, life gets messy, and not all groups are created equal! And last but not least, One-Way ANOVA only tells you if there is a significant difference between groups, but it won't tell you which group(s) are different. So, while it's a nifty tool, One-Way ANOVA does have its limitations. Just like your favorite superhero, it's not always the right fit for every situation. Keep this in mind while analyzing your data!
In conclusion, One-Way ANOVA is a handy tool for drawing insights from data with multiple groups, but it's not without its limitations. By mastering this technique and understanding its results, you'll be on your way to becoming a data science superhero! So put on that cape, grab your Python toolkit, and let the statistical adventures begin! Happy coding!