Outliers cleaning in dataset.
Embark on a fascinating journey into the world of Euclidean distance outliers with Python, where data analysis and geometry converge to unveil hidden patterns and anomalies. In this comprehensive guide, we'll explore the power of Python to detect and analyze outliers using the Euclidean distance metric, providing you with invaluable insights to enhance your data-driven decision-making process.

Python Knowledge Base: Make coding great again.
- Updated:
2026-07-21 by Andrey BRATUS, Senior Data Analyst.
Understanding Euclidean Distance.
Detecting Outliers using Euclidean Distance.
Calculation of Euclidean Distance in Python.
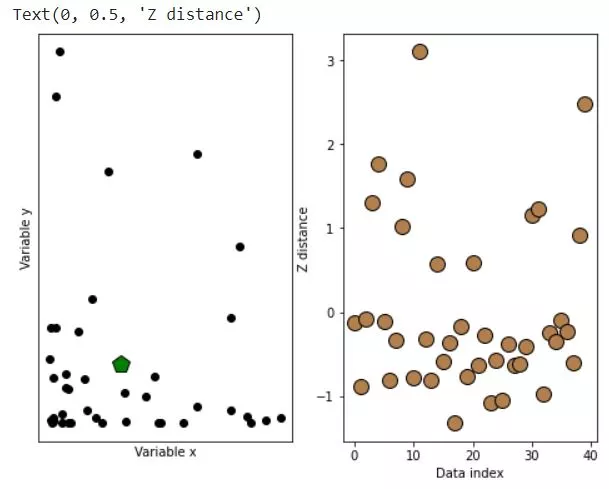
Creating data, calculating distancies and plotting:
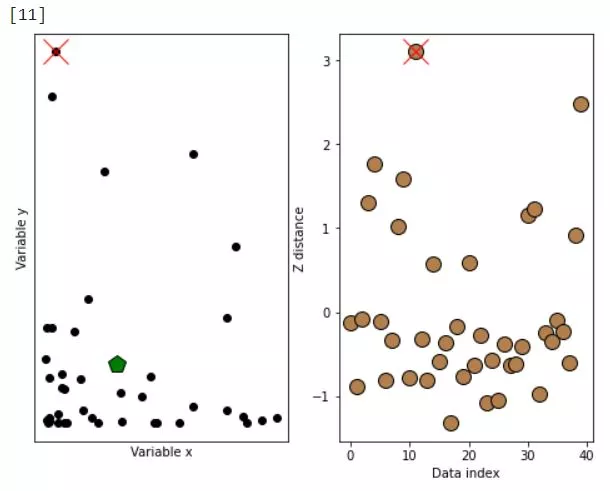
Identifying the outliers:
Dealing with Outliers.
Best Practices: Mastering Euclidean Distance Outliers in Python.
Conclusion.
Get ready to dive deep into the realm of multidimensional data, as we unravel the secrets of Euclidean distance and its applications in the ever-evolving field of data science.
Euclidean Distance is a powerful mathematical tool that helps in measuring the distance between two points. It has its application in various fields of work such as science, engineering, and finance. One of its essential uses is in identifying outliers.
The significance of Euclidean Distance in identifying outliers has been growing because of its accuracy and speed. By utilizing various techniques and algorithms, we can detect and remove the outliers.
Let's hop into the world of Euclidean Distance Outliers!
Euclidean Distance, also known as Euclidean metric, is a method used to measure the distance between two points in a plane or multi-dimensional space. It is the most commonly used distance metric, and it forms the basis of many machine learning algorithms.
The formula for calculating Euclidean Distance is pretty straightforward. You simply take the square root of the sum of the squared differences between the coordinates of two points. This method is especially useful when trying to identify outliers in a dataset.
For example, imagine you have a dataset containing data points representing the heights and weights of different individuals. With Euclidean Distance, you can quickly identify any data points that fall far from the norm, indicating that they may be outliers.
Overall, Euclidean Distance is a simple yet powerful tool for anyone working with datasets.
Outliers can be defined as data points that are distant from the majority of the other data points in a dataset. These data points may be erroneous or may have been influenced by external factors. In data analysis, it is important to detect these outliers and analyze them separately, as they can significantly impact the results of the analysis.
Euclidean distance is commonly used to identify outliers in a dataset as it measures the distance between two data points in a multidimensional space. Outliers are identified by computing the Euclidean distance between each data point and its nearest neighbors. The points that are furthest away from their nearest neighbors are considered as potential outliers.
In addition to Euclidean distance, there are other common techniques for detecting outliers such as Z-score, boxplots, and local outlier factor (LOF). Each of these techniques has its strengths and weaknesses.
The choice of technique depends largely on the nature of the dataset and the purpose of the analysis. However, Euclidean distance is one of the simplest and most effective techniques for detecting outliers and is widely used in various fields such as finance, healthcare, and marketing.
In the next section, we will discuss how to calculate Euclidean distance in Python, which is a powerful tool for data analysis that supports various libraries and modules to perform complex calculations with ease.
When it comes to calculating Euclidean Distance in Python, there are two main approaches: using inbuilt libraries or manually computing it.
Python offers many inbuilt libraries that enable fast and easy computation of the Euclidean Distance. One of the most popular libraries is NumPy, which includes a function called "linalg.norm" that can compute the Euclidean Distance between two arrays. This function is fast and efficient, making it a great option for large datasets. Another popular library is SciPy, which has a module called "spatial.distance" that includes a function for computing the Euclidean Distance.
Alternatively, you can manually compute the Euclidean Distance in Python. This involves writing a function that uses the Euclidean Distance formula, which is the square root of the sum of the squared differences between corresponding elements in two arrays. While this approach can take longer and is more complex, it gives you more control over the computation and can be useful for smaller datasets.
Whether you choose to use inbuilt libraries or manually compute the Euclidean Distance, it is important to understand the strengths and weaknesses of each approach. In general, inbuilt libraries are faster and easier to use but may be less flexible, while manual computation is more customizable but can be more time-consuming.
So, when calculating Euclidean Distance in Python, it's important to choose the right approach based on your specific needs and goals.
import numpy as np
import matplotlib.pyplot as plt

## creating data

N = 40

# two-dimensional data
d1 = np.exp(-abs(np.random.randn(N)*3))
d2 = np.exp(-abs(np.random.randn(N)*5))
datamean = [ np.mean(d1), np.mean(d2) ]


# compute distance of each point to the mean
ds = np.zeros(N)
for i in range(N):
    ds[i] = np.sqrt( (d1[i]-datamean[0])**2 + (d2[i]-datamean[1])**2 )


# convert to z (don't need the original data)
ds = (ds-np.mean(ds)) / np.std(ds)


# plot the data
fig,ax = plt.subplots(1,2,figsize=(8,6))

ax[0].plot(d1,d2,'ko',markerfacecolor='k')
ax[0].set_xticks([])
ax[0].set_yticks([])
ax[0].set_xlabel('Variable x')
ax[0].set_ylabel('Variable y')

# plot the multivariate mean
ax[0].plot(datamean[0],datamean[1],'kp',markerfacecolor='g',markersize=15)

# then plot those distances
ax[1].plot(ds,'ko',markerfacecolor=[.7, .5, .3],markersize=12)
ax[1].set_xlabel('Data index')
ax[1].set_ylabel('Z distance')
IMPORTANT !: choose the threshold wisely depending on data (usually between 3 and 2).
# threshold in standard deviation units
distanceThresh = 2.5

# find the offending points
oidx = np.where(ds>distanceThresh)[0]

print(oidx)


# and cross those out
ax[1].plot(oidx,ds[oidx],'x',color='r',markersize=20)
ax[0].plot(d1[oidx],d2[oidx],'x',color='r',markersize=20)

fig
Outliers can have a profound impact on your analysis. They can skew your results and make your life a living hell. Not to mention, they're often difficult to identify and can come in all shapes and sizes. But fear not, there are strategies you can employ to deal with these pesky outliers.
One important step is to understand the impact of outliers on your analysis. Depending on your use case, outliers may or may not be an issue. In some cases, they may even be the key to unlocking insights and trends. On the other hand, they can also have a detrimental effect on the validity of your analysis.
Once you've identified outliers, it's important to deal with them appropriately. One strategy is to remove them from your dataset altogether. However, this approach should be taken with caution, as it can also lead to skewed results. Another approach is to cap or Winsorize the outliers, which involves replacing them with the closest non-outlier value.
So next time you're faced with outliers, don't panic. Take the time to understand their impact and employ appropriate strategies to deal with them. With a little perseverance and the right tools, you'll be mastering Euclidean distance outliers like a pro in no time.
Before you dive into the technicalities, let's discuss some best practices that can make your journey a little less bumpy.
Firstly, visualizing outliers can give you a better understanding of your data and the impact of the outliers. Secondly, choosing the right distance metric can make a huge difference in your analysis. Thirdly, understanding the context of the data is crucial, as it can help you identify outliers that may not be obvious at first glance. And last but not least, iterating and refining your approach is key to mastering any skill.
Remember, it's not just about getting the code right, it's about understanding the problem and the best way to approach it. So, don't be afraid to experiment and take your time.
In conclusion, Euclidean distance is an essential tool for identifying outliers in data analysis. With its accuracy and speed, it has become a popular metric for detecting outliers in datasets across various domains. By utilizing techniques such as computing the Euclidean distance, Z-score, boxplots, or local outlier factor (LOF), we can effectively detect and remove outliers, leading to better results in our analysis.