CDF quick dive.
Unleash the power of Python and unlock the mysteries of the Cumulative Distribution Function (CDF) with our comprehensive guide! Journey into the fascinating world of statistics and explore the versatile application of CDF for advanced data analysis in various fields. With our step-by-step tutorials, beginner-friendly explanations, and expert tips, we make it incredibly easy to master the art of transforming complex datasets into meaningful insights using Python's vast array of libraries and functionalities.
Discover your gateway to unparalleled statistical prowess and conquer the world of data like never before!

Python Knowledge Base: Make coding great again.
- Updated:
2026-07-22 by Andrey BRATUS, Senior Data Analyst.
What is a cumulative distribution function?
Types of Cumulative Distribution Functions.
Calculating and drawing PDFs and CDFs:
Computing the cdf from the pdf (overlapping):
Applications of Cumulative Distribution Function in Data Science.
Conclusion.
In statistics, the cumulative distribution function (CDF) is a function that shows the probability that a random variable takes on a value less than or equal to a chosen value. It's a type of probability distribution function and is defined for both continuous and discrete variables.
Why is a cumulative distribution function important? It's an essential tool in statistical analysis and plays a critical role in hypothesis testing, random variable generation, and quantile estimation. With a CDF, you can compute any percentile of a distribution and know the probability that a random variable takes on a value within a specified range.
Applications of a cumulative distribution function are widespread in many fields, including finance, economics, and engineering. In finance, CDFs help investors predict the likelihood of future events, like stock market crashes. In engineering, CDFs help predict the probability of product failure. With Python, you can conveniently compute and visualize CDFs, making it a valuable tool for data scientists and statisticians.Understanding Probability distribution functions
Probability distribution function is a concept that underlies most of statistics and machine learning models. It is a function that maps all possible outcomes of an experiment to their respective probabilities. The values of the probability density function can be continuous or discrete. Understanding the concept of probability distribution function can help to identify which type of distribution to use in a machine learning model. There are several types of probability distribution functions, including the normal distribution, binomial distribution, Poisson distribution, and exponential distribution. Each of these has its unique characteristics and uses in data science. In the following sections, we will take a deeper dive into probability distribution functions to understand their relevance in data analysis and how to use them in a Python environment.
Cumulative Distribution Function (CDF) is a probability function that indicates the probability of a random variable being less than or equal to a given input value. There are mainly two types of CDFs: Empirical Cumulative Distribution Function (ECDF) and Parametric Cumulative Distribution Function.
Empirical CDF is constructed from observed data in a non-parametric way. It is used when we do not have much idea about the data distribution. On the other hand, Parametric CDF is constructed by assuming a particular parametric form for the data distribution. It is used when we have some prior domain knowledge about the distribution.
ECDF can be constructed quickly, and the interpretation of results is straightforward. It is also more robust to outliers in the data. However, due to the inherent randomness of finite data, ECDF is subject to random fluctuations.
Parametric CDF has the advantage of being more flexible and capable of better fitting the data distribution. It gives more precise results with relatively small sample sizes. However, the parametric form may not be suitable for all types of data, and the results may be sensitive to the choice of parametric form.
Therefore, the preference between ECDF and Parametric CDF depends on the availability of data, the domain knowledge, and the research questions. In the following sections, we will see how to construct and visualize both types of CDF using Python.
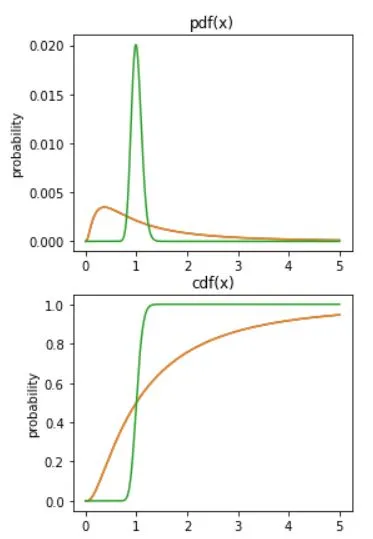
The cumulative distribution function (cdf) is the probability that the variable takes a value less than or equal to x. As by definition it will cumulate or sum all values of pdfs less than or equal to x at each given moment, so graphically it will start at 0 and end in probability of 1 or 100%.
import matplotlib.pyplot as plt
import numpy as np
import scipy.stats as stats

## this example uses log-normal distribution

# variable to evaluate the functions on
x = np.linspace(0,5,1001)

# note the function call pattern...
p1 = stats.lognorm.pdf(x,1)
c1 = stats.lognorm.cdf(x,1)

p2 = stats.lognorm.pdf(x,.1)
c2 = stats.lognorm.cdf(x,.1)

# draw the pdfs
fig,ax = plt.subplots(2,1,figsize=(4,7))

ax[0].plot(x,p1/sum(p1)) # question: why divide by sum here?
ax[0].plot(x,p1/sum(p1), x,p2/sum(p2))
ax[0].set_ylabel('probability')
ax[0].set_title('pdf(x)')

# draw the cdfs
ax[1].plot(x,c1)
ax[1].plot(x,c1, x,c2)
ax[1].set_ylabel('probability')
ax[1].set_title('cdf(x)')
plt.show()
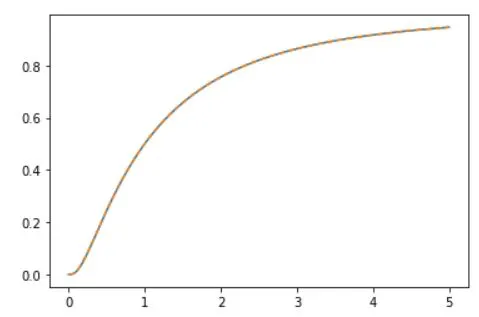
The following visualization of overlapping curves shows perfect example that sum of pdfs is equal to cumulative distribution function at any moment for arbitrary example of data.
# compute the cdf
c1x = np.cumsum( p1*(x[1])-x[0] )

plt.plot(x,c1)
plt.plot(x,c1x,'--')
plt.show()
As a data scientist, you'll find the Applications of Cumulative Distribution Function (CDF) are endless. One of the most important applications is hypothesis testing. Testing a hypothesis is the process of determining the statistical significance of the results of a study or experiment. CDFs are used to define the null hypothesis distribution, against which the sample is compared. This helps you determine how likely it is that the sample came from that population. If it's unlikely, you can reject the null hypothesis and conclude that there is a significant difference between the sample and the population.
Random variable generation is another key application of CDFs. Given a probability distribution function, you can use the inverse transform method to generate random numbers that follow that distribution. This is useful for simulations and modeling, as it allows you to create data that follows a known distribution.
Finally, CDFs can be used to estimate quantiles. A quantile is a value below which a certain proportion of the data falls. For example, the median is the 50th percentile, meaning that 50% of the data is below it. CDFs allow you to find the quantiles of a distribution, making it easy to compare different datasets or determine cutoff values.
These are just a few of the applications of CDFs in data science. Whether you're testing hypotheses, generating random variables, or estimating quantiles, knowing how to work with CDFs is an essential skill for any data scientist.
To sum up, Cumulative Distribution Function is a robust tool used for data analysis and is commonly used in hypothesis testing, quantile estimation, and generating random variables. Understanding the types of CDFs and constructing them using Python libraries helps to accurately describe and visualize datasets. So, incorporate this useful tool in your data science toolkit and analyze data like a pro!