Permutation testing in statistics.
Embark on a journey through our comprehensive guide on permutation testing for t-tests, implemented with Python - an essential skill for data enthusiasts and statisticians alike. In an era where data is king, understanding sophisticated statistical methods such as permutation testing is more crucial than ever. This guide is designed for both experienced data analysts seeking to enhance their skill set and aspiring statisticians ready to immerse themselves in Python's statistical capabilities. Prepare to elevate your data analysis expertise as we navigate the fascinating realm of permutation testing.

Python Knowledge Base: Make coding great again.
- Updated:
2026-07-16 by Andrey BRATUS, Senior Data Analyst.
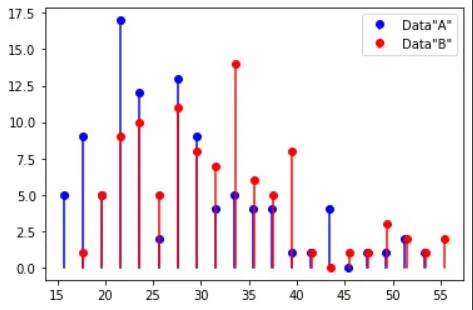
Generating initial data for permutation testing:
Generating null hypothesis scenario:
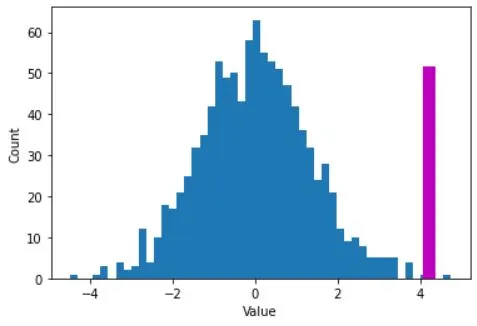
Distribution of null hypothesis values:
Two methods of evaluating statistical significance for permutation testing:
Advantages and limitations.
Conclusion.
Permutation testing is a nifty technique that allows us to assess the significance of a sample result by shuffling and rearranging our data. By doing this, we can simulate the null hypothesis, where there is no true difference between groups.
Permutation tests (also known as re-randomization test) are non-parametric tests that used when we don’t know much about data nature.
The theoretial difference between permutation tests and inferential tests is that with permutation tests we build the sampling distribution from the observed data, rather than infering or assuming that a sampling distribution exist.
The distribution of the test statistic under the null hypothesis is made by calculating possible values of the test statistic under all possible rearrangements of the observed data points. So permutation test can be considered as a form of artificial resampling.
The method simply generates the distribution of mean differences under the assumption that the two groups are not distinct in terms of the measured variable.
Permutation test are consedered as an alternative to classical two-sample t-test.
import matplotlib.pyplot as plt
import numpy as np
import scipy.stats as stats

# number of trials
N = 100

# dataset "A"
r = np.random.randn(N)
r[r>0] = np.log(1+r[r>0])
dataA = 26-r*10

# get histogram values for later comparison
yA,xA = np.histogram(dataA,20)
xA = (xA[:-1]+xA[1:])/2

# dataset "B"
r = np.random.randn(N)
r[r>0] = np.log(1+r[r>0])
dataB = 30-r*10

#get histogram values for later comparison
yB,xB = np.histogram(dataB,20)
xB = (xB[:-1]+xB[1:])/2


plt.stem(xA,yA,'b',markerfmt='bo',basefmt=' ',label='Data"A"')
plt.stem(xB,yB,'r',markerfmt='ro',basefmt=' ',label='Data"B"')
plt.legend()
plt.show()
## mix datasets together

# concatenate trials
alldata = np.hstack((dataA,dataB))

# condition labels
conds = np.hstack((np.ones(N),2*np.ones(N)))

# random permutation
fakeconds = np.random.permutation(N*2)

# shuffled condition labels
fakeconds[fakeconds<=N] = 1
fakeconds[fakeconds>1] = 2


# these two means should be different.
print([np.mean(alldata[conds==1]), np.mean(alldata[conds==2])])

# should these two be different?
print([np.mean(alldata[fakeconds==1]), np.mean(alldata[fakeconds==2])])
OUT: [27.54863852696174, 31.75392717918671]
[28.886385003016894, 30.416180703131555]
nPerms = 1000
permdiffs = np.zeros(nPerms)

for permi in range(nPerms):
    fconds = np.random.permutation(N*2)
    fconds[fconds1] = 2
    permdiffs[permi] = np.mean(alldata[fconds==2]) - np.mean(alldata[fconds==1])


# plot the distribution of H0 values
plt.hist(permdiffs,50)

# and plot the observed value on top
obsval = np.mean(alldata[conds==2]) - np.mean(alldata[conds==1])
plt.plot([obsval, obsval],[0, 50],'m',linewidth=10)
plt.xlabel('Value')
plt.ylabel('Count')
plt.show()
##

# Z-value
zVal = ( obsval-np.mean(permdiffs) ) / np.std(permdiffs,ddof=1)
p = 1-stats.norm.cdf(abs(zVal))

# p-value count
pCount = sum(permdiffs>obsval)/nPerms

print(p,pCount)
OUT: 0.0008127353958568007 0.001
Permutation testing for t-Test offers some amazing advantages that will make you shout, "Who needs traditional methods anyway?"
Advantage #1: No Assumptions, No Worries
Permutation testing doesn't require any assumptions about the data distribution, so you can bid farewell to stressful assumptions that keep you up at night. Whether your data is normally distributed, skewed, or completely bonkers, permutation testing has got your back.
Advantage #2: Ultimate Flexibility
Unlike other hypothesis testing methods, permutation testing allows you to examine any type of relationship between variables. You can analyze categorical data, ratios, counts, and even the number of doughnuts you eat while coding (not that we endorse doughnut-fueled coding sessions... we just find it fascinating).
Advantage #3: Light Speed Results
Permutation testing is lightning fast, providing you with results that make the Flash jealous. No more waiting around for your p-values to pop up. With permutation testing, you can reveal the magic in seconds and get on with your exciting data exploration journey.
But hey, let's not forget that every superhero has its limitations. Even permutation testing has a few quirks you should be aware of.
Limitation #1: Sample Size Matters
Permutation testing can be quite demanding in terms of computational resources, especially when dealing with large sample sizes. So if your dataset is bigger than a Thanksgiving feast, buckle up for potentially longer processing times. Patience is a virtue, my friend.
Limitation #2: Can't Handle Missing Values... For Now
Permutation testing, unfortunately, doesn't play well with missing values. If your dataset has any AWOL values, you'll have to find a way to fill in the gaps or consider other alternatives (we'll talk about those later).
But fear not, brave adventurer! Even in the face of limitations, there are alternative methods to explore. You can try non-parametric tests like the Mann-Whitney U test or bootstrap resampling methods to satisfy your statistical curiosity.
So go forth, embrace the advantages, beware of the limitations, and let permutation testing be your trusty sidekick in the world of hypothesis testing. Happy testing!
Permutation testing is an incredibly important tool when it comes to analyzing t-test results. It helps us determine whether our observed differences are statistically significant or just a fluke.
By using permutation testing, we can confidently interpret the results of our t-test and make informed decisions based on the p-value. Plus, it allows us to account for any potential biases or anomalies in our data.
Now, I don't want to dictate your actions, but I would highly encourage you to try out permutation testing in practice. Go ahead, take the plunge, and see for yourself how it enhances the way you analyze and interpret t-test results. Trust me, you won't be disappointed!