Let's dive into Yandex Metrika API.
Welcome to the world of advanced analytics with our comprehensive guide on using Yandex Metrika API with Python. As the digital landscape becomes increasingly competitive, understanding your website's performance is crucial. With our Python bot, you can harness the power of Yandex Metrika API to gain valuable insights into your website's traffic, user behavior, and much more. Whether you're a seasoned developer or a beginner, our step-by-step guide will help you navigate the complexities of Yandex Metrika API, enabling you to optimize your site's performance and reach your SEO goals.

Python Knowledge Base: Make coding great again.
- Updated:
2026-07-22 by Andrey BRATUS, Senior Data Analyst.
Working with Yandex Metrika.
Yandex Metrika API bot Python code:
Analyzing Data using Python.
Use Cases of Yandex Metrika API with Python.
Conclusion.
Retrieving data from Yandex Metrika API is one of the primary functionalities of using this API with Python, and it involves connecting to the API and requesting data. The process requires specifying parameters such as the metrics (e.g. page views, visits), dimensions (e.g. date, location), and filters (e.g. search query, traffic source) for the data to be retrieved. Custom requests can be made using the API to retrieve data that meets specific criteria.
Creating custom reports is another key feature of Yandex Metrika API with Python, and it allows users to generate detailed reports using data retrieved from the API. The report can be customized by selecting specific metrics, dimensions, and filters, and it can be saved into various formats, including CSV, Excel, or PDF.
While working with Yandex Metrika API, error handling is crucial, and you must be familiar with common issues that may arise while attempting to retrieve data. For instance, you may encounter error HTTP status codes such as 400 (Bad Request) or 401 (Unauthorized) when connecting to the API. You can handle these errors using Python's built-in libraries such as requests or exceptions.
In addition, when managing data retrieved from Yandex Metrika API, it's important to ensure data quality and accuracy. Valid data is essential to draw meaningful insights and make informed decisions. By using data cleansing techniques such as removing irrelevant data or checking for inconsistencies, you can ensure the data is clean and accurate.
In conclusion, working with Yandex Metrika API in Python involves retrieving data from the API, creating custom reports, handling errors and exceptions, and ensuring data quality. By effectively managing these aspects, users can draw valuable insights from the data in a meaningful and customized way.
Let's dive into the world of data-driven decision making!
If you use and monitor your web site statistics using Yandex Metrika, you can easily utilize Yandex Metrika API and Python to download all necessary data and use it later in external tools. You can conver downloaded data to .XLS or .CSV if necessary or just visualize output dataframe. You can also make use of Matplotlib and/or Seaborn to make additional graphs, but visualisation tasks are outside of the Yandex Metrika data extraction task.
The Yandex Metrika API is well documented on it's web page, to make the Python script below work all you have to do :
- Create an application to use Yandex Metrika API.
- Choose the name you want and select web-services type.
- Select section to use Yandex Metrika statistics.
- Get user ID and password and generate token.
- Run the script below, set ACCESS_TOKEN and METRIC_ID of your website.
- Uncomment line to export results to Excel if necessary.
from tapi_yandex_metrika import YandexMetrikaStats
import json
import pandas as pd

# use your access token
ACCESS_TOKEN = "AQAAAAAn5gQWAAhDiTiBm092p00djLuN-xEgk-a"
# use your metric ID
METRIC_IDS = "88167562"

# set limit or get 10000 rows by default

api = YandexMetrikaStats(
    access_token=ACCESS_TOKEN,
    # if True, all data will be loaded, False by default
    receive_all_data=True
)
#parameters for tapi_yandex_metrika
params = dict(
    ids = METRIC_IDS,
    metrics = "ym:s:users,ym:s:visits,ym:s:pageviews,ym:s:bounceRate,ym:s:pageDepth,ym:s:avgVisitDurationSeconds",
    dimensions = "ym:s:date,ym:s:TrafficSource,ym:s:SourceEngine,ym:s:gender",
    date1 = "2daysAgo",
    date2 = "yesterday",
    sort = "ym:s:date",
    accuracy="full",
    limit = 300
)
#getting data Yandex.Metrika API
result = api.stats().get(params=params)
result = result().data
result = result[0]['data']

dict_data = {}
#parsing Json into dictionary
for i in range(0, len(result)-1):
    dict_data[i] = {
            'date':result[i]["dimensions"][0]["name"],
            'traffic-source':result[i]["dimensions"][1]["name"],
            'traffic-details':result[i]["dimensions"][2]["name"],
            'users':result[i]["metrics"][0],
            'visits':result[i]["metrics"][1],
            'pageviews':result[i]["metrics"][2],
            'bounceRate':result[i]["metrics"][3],
            'pageDepth':result[i]["metrics"][4],
            'avgVisitDurationSeconds':result[i]["metrics"][5]
          }
#creating DataFrame from dictionary
dict_keys = dict_data[0].keys()
df = pd.DataFrame.from_dict(dict_data, orient='index',columns=dict_keys)
#export to Excel
# df.to_excel("Report.xlsx", sheet_name='data', index=False)
df
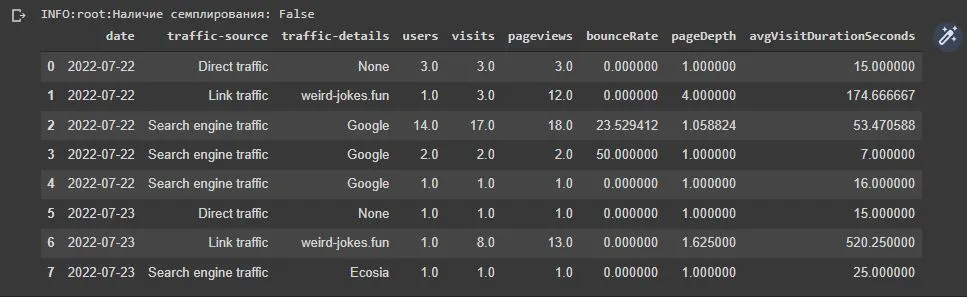
Now that we have successfully retrieved data from the Yandex Metrika API using Python, it's time to dive into the exciting world of data analysis. There are various tools available in Python that can be used for data analysis, and we will be exploring a few of them here.
We can start with Pandas, a powerful data analysis tool that allows us to manipulate and analyze data easily. With Pandas, we can perform tasks like filtering, sorting, and grouping data. We can also use functions like mean(), median() and sum() to perform statistical analysis on the data.
Another popular tool in the world of data analysis is Matplotlib, which allows us to visualize data using various charts and graphs. With Matplotlib, we can create line graphs, bar graphs, scatter plots, and even heatmaps. Visualizing data can help us identify patterns and trends that might not be immediately apparent in the raw data.
Finally, we can use tools like Jupyter notebooks, which provide an interactive environment for data analysis and visualization. Jupyter notebooks allow us to write and run Python code directly in our web browser, and we can also include text and images to create a more engaging and informative presentation.
By combining these tools, we can perform in-depth analysis on Yandex Metrika data and extract valuable insights that can inform our business decisions. Whether we are tracking e-commerce sales, analyzing social media engagement, or measuring content performance, Python and Yandex Metrika API provide a powerful toolkit for data analysis.
What can you do with Yandex Metrika API and Python? A lot! You can track your e-commerce sales data, analyze social media traffic, and measure content performance. E-commerce tracking can help you understand what is working and what isn't with your online store. Social media tracking can help you identify which platforms are driving the most traffic to your site. Content performance analysis can help you measure the effectiveness of your blog posts and other content. With Yandex Metrika API and Python, the possibilities are endless!
To summarize, using Yandex Metrika API with Python is an efficient way to retrieve data, create custom reports, and analyze website performance. With Python modules, you can easily generate insights from website performance and extract actionable data. In the future, there is great potential to keep innovating with the use of Yandex Metrika API and Python for diverse applications, such as e-commerce and social media tracking.