Using technical indicators for trading.
Technical analysis is the way for investors to read the market sentiment via the use of special patterns and signals. Sometimes it is considered as the opposite way to Fundamental analysis to understand the market trends. There are plenty of standard and 'secret' technical indicators exist, but it is defently recommended to start from main KPIs such as SMA, RSI and MACD.

Python Knowledge Base: Make coding great again.
- Updated:
2026-07-18 by Andrey BRATUS, Senior Data Analyst.
Python code to get Simple Moving Average (SMA):
Python code to get Relative Strength Index (RSI):
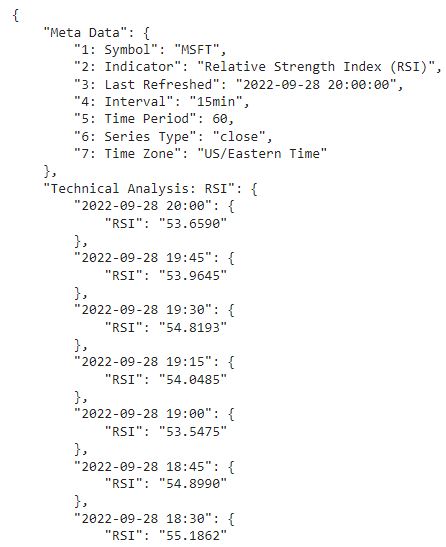
Relative Strength Index (RSI) output:
Python code to get Moving Average Convergence/Divergence (MACD):
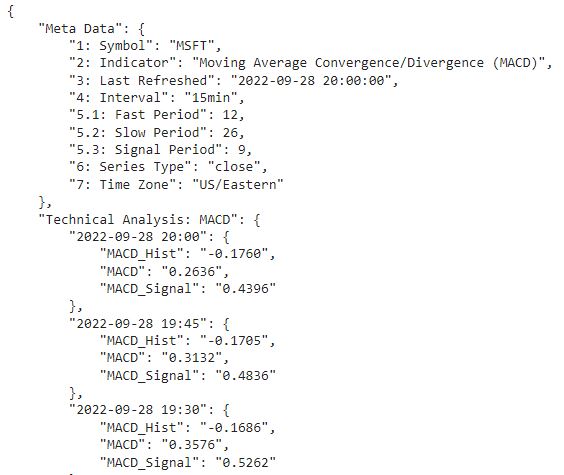
Moving Average Convergence/Divergence (MACD) output:
In our case we will use Python to access trading technical indicators from Alpha Vantage which offers free stock APIs in JSON / CSV formats for realtime and historical stock market data, forex and cryptocurrency feeds. Output data is in JSON format which can be easily converted to any suitable form for further visualisation and analysis.
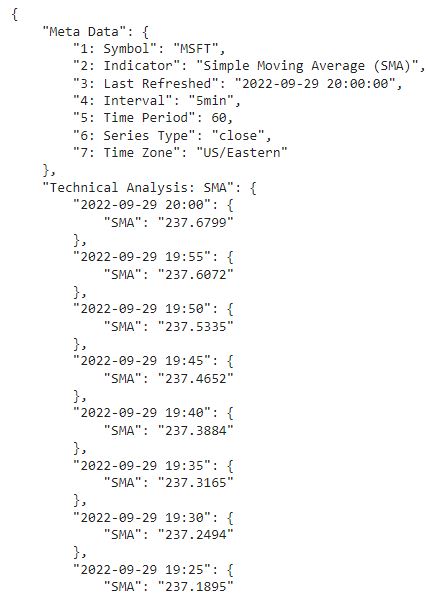
SMA is a technical indicator that shows the average price of an asset over a specific period of time and is calculated by taking a series of prices that are added together and then divided by the number of data points.
import requests

url = "https://alpha-vantage.p.rapidapi.com/query"

querystring = {"time_period":"60","interval":"5min","series_type":"close","function":"SMA","symbol":"MSFT","datatype":"json"}

headers = {
"X-RapidAPI-Key": "your-api-key",
"X-RapidAPI-Host": "alpha-vantage.p.rapidapi.com"
}

response = requests.request("GET", url, headers=headers, params=querystring)

print(response.text)
Simple Moving Average (SMA) output:
RSI is a momentum oscillator that measures the speed and change of price movements.
import requests

url = "https://alpha-vantage.p.rapidapi.com/query"

querystring = {"time_period":"60","interval":"15min","series_type":"close","function":"RSI","symbol":"MSFT","datatype":"json"}

headers = {
"X-RapidAPI-Key": "your-api-key",
"X-RapidAPI-Host": "alpha-vantage.p.rapidapi.com"
}

response = requests.request("GET", url, headers=headers, params=querystring)

print(response.text)
MACD is a trading indicator used in technical analysis of stock prices, is designed to reveal changes in the strength, direction, momentum, and duration of a trend in a stock's price.
import requests

url = "https://alpha-vantage.p.rapidapi.com/query"

querystring = {"time_period":"60","interval":"15min","series_type":"close","function":"MACD","symbol":"MSFT","datatype":"json"}

headers = {
"X-RapidAPI-Key": "your-api-key",
"X-RapidAPI-Host": "alpha-vantage.p.rapidapi.com"
}

response = requests.request("GET", url, headers=headers, params=querystring)

print(response.text)